

Nominally Hedged: The Supply Side Read the Book
Q1 2026 Compression Earnings: Lead Times, Leverage, and the End of Buyer's Markets

The Game
There are, broadly speaking, two ways to make money selling oilfield services. You can be better than the other guy. Or you can arrange things so that there is no other guy. For about thirty years, the service sector tried option one and mostly failed. Competing on quality in a commoditized market is a treadmill: you invest in differentiation, your competitor copies it, pricing resets to marginal cost, and everybody goes home with a 6% EBITDA margin and a management team that describes the year as “challenging but encouraging.” The operator, meanwhile, runs the RFP, picks the cheapest bid that meets spec, and moves on to the next line item. This was a comfortable arrangement for everyone except the people selling the services.
What I want to walk through today is how three major cost categories on your AFE independently arrived at option two: make supply scarce. They did it through completely different mechanisms. They did not coordinate. And the cumulative effect on your well economics is not the sum of the three individual price increases. It is the product. That distinction matters and I will come back to it.
Game theorists have a term for what happens when independent players converge on the same strategy without coordinating: dominant strategy equilibrium. It means that constraining supply is the best move for each player regardless of what the other players do. You do not need a cartel when the incentives are this clean. You just need every participant to independently read the same page of the same textbook, which, as it turns out, they all did.
The frac companies chose it deliberately.
Liberty, ProPetro, Patterson: the diesel fleets are being actively retired even when they are still mechanically capable. 1.1 million hydraulic horsepower retired in 2024 and 2025. Zero replacement equipment built. Active frac spreads have dropped from roughly 280 at the 2022 peak to approximately 200 today. That sounds like a demand story until you look at completion volumes, which have not declined proportionally. What declined is the number of providers willing to show up and compete at spot rates.
The mechanism is elegant in a way that deserves a moment of appreciation. You take the top of the market, lock it into long-term contracts on e-fleet and simul-frac, and call it “technology differentiation” (which it partly is). This strands the bottom of the market with too few bidders to sustain spot pricing. The spot pricing collapse then justifies retiring the diesel fleets (why keep a fleet running that earns 8% returns?), which constrains total capacity, which supports the premium on the differentiated equipment, which funds more retirements. Game theorists call this Kreps-Scheinkman: firms commit to capacity levels first, then compete on price given those commitments. The frac companies figured out that the optimal capacity commitment is less. Just, less. Make less of the commodity. Charge more for what remains. This is supposed to be hard to sustain because someone always cheats and adds capacity. Nobody is cheating. The returns on cheating (deploying a diesel fleet at spot rates into a market with 200 active spreads) are worse than the returns on not cheating. The equilibrium holds.
(If this sounds familiar, it should. Liberty is now spending $3.50 on power generation capital for every $1 on frac. KGS is spending roughly $1.70 on power for every $1 on compression. Two different service categories, same arithmetic: the core business has become the harvest asset that funds a power generation buildout. The vendors converged on the same capital allocation without coordinating, which tells you everything about where the returns are.)
The OCTG mills had it done for them, which is even better.
Tariffs do not reduce global tubular supply. They reduce the *substitutable* supply available to a U.S. operator, which from your perspective is the same thing. Section 232 duties, anti-dumping and countervailing duties on Korean and Chinese product, and the cascading effect on trade flows from allied mills have compressed the viable import pool to a fraction of what it was in 2018.
There is a classic game theory model for this called Bain-Dixit entry deterrence, where the incumbent has to do something expensive to keep competitors out: build excess capacity, price aggressively, invest in switching cost barriers. The OCTG mills got a much better deal. The government did the deterring for free. The domestic mills with integrated threading and LML capability now have something close to a regional monopoly on production casing, not because they earned it through competitive excellence, but because the trade policy environment handed it to them. (This is not a criticism. If someone offers you a monopoly, you take it. That is also in the textbook.) One market became two: premium grades requiring specifications, certifications, and institutional relationships became calcified domestic territory. Commodity grades remained contestable but heavily penalized on imported substrate. The strategic question (and the one worth watching) is what the mills do with the rents. The answer is visible in every quote you have received in the last twelve months.
The compression vendors had it done for them, and then, remarkably, chose to make it worse.
Caterpillar’s 3600 in-line engine backlog created the constraint. Cat is reallocating production capacity toward power generation turbines, where a single hyperscaler signs a contract worth more than the entire annual output of the compression aftermarket. The compression companies did not ask for a 180-week lead time. But they recognized its strategic value immediately: when nobody can build a new unit for three and a half years, every installed unit is a monopoly franchise that reprices at renewal.
The textbook response to an upstream supply constraint is to diversify your supply chain. Find alternative inputs. Develop substitutes. Invest in the bottleneck. What the compression vendors actually did was the opposite. KGS spent $675 million buying a distributed power company that competes for the same Caterpillar engines that build its compression units. (Read that sentence again slowly.) USAC acquired J-W Power and redirected its manufacturing capacity toward internal fleet growth rather than third-party sales. Archrock pulled back EMD orders because the grid cannot support them, further concentrating demand on gas-drive engines with the longest lead times. The exogenous constraint arrived, and every vendor chose to deepen it.
In game theory terms, this is a Cournot model with an exogenous capacity ceiling, except the ceiling is set by someone (Caterpillar, responding to Microsoft) who does not know or care what a compression unit costs to rent per horsepower per month. The compression vendors are price-takers on capacity and price-setters on rental rates. That is an extraordinarily comfortable position to find yourself in, and they are behaving accordingly.
Three cost categories. Three mechanisms. One dominant strategy. The operator’s instinct to treat each of these as a separate procurement problem, to run three different RFPs and manage three different vendor relationships as though they operate in independent markets, misses that they are three expressions of the same structural shift. The supply side read the textbook. Every chapter. Including the one about what happens to the buyer.
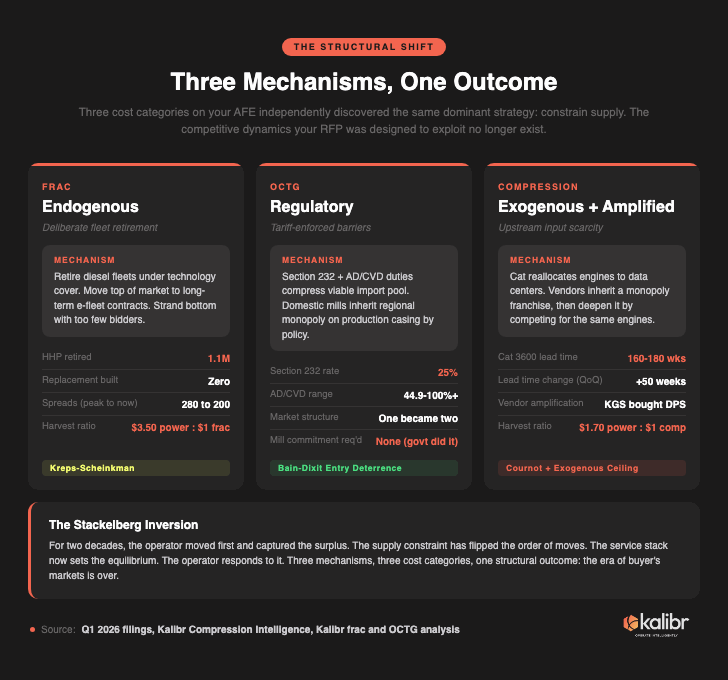
What happened to the buyer is this: for two decades, the operator was the Stackelberg leader. You moved first (set the budget, defined the program, issued the RFP) and the service stack’s best response was already constrained by your choice. That is over. The service providers and their upstream input markets now set the equilibrium. You observe and respond. The math has not changed. The player who moves first still captures the surplus.
The player who moves first is no longer you.
This is the context in which Q1 2026 compression earnings should be read. Not as a quarterly update on three companies. As the most developed case study of a structural shift that has already reached your frac spread and your casing program, and that will define your F&D trajectory for the next three to five years.
The Lead Time
The single most important number in the Q1 filings is not a margin or a utilization rate.
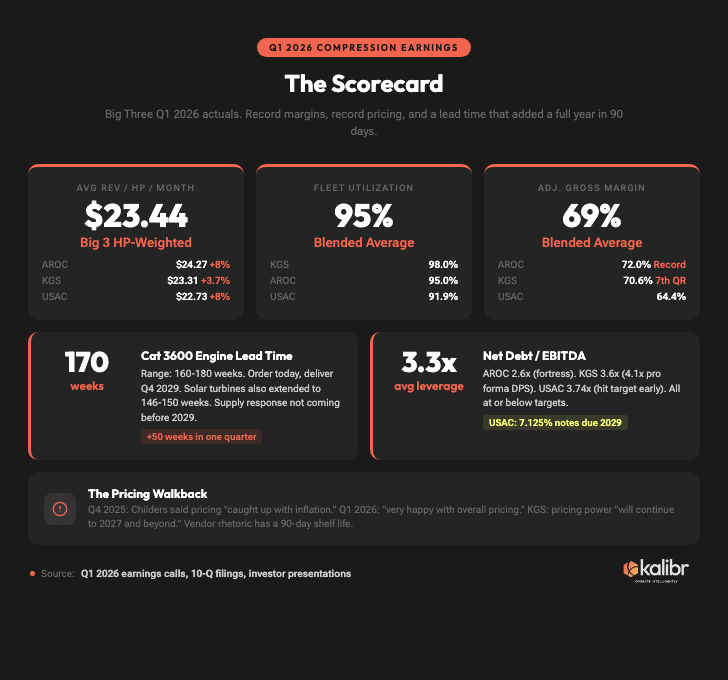
Caterpillar 3600 in-line engine lead times extended from 110 to 120 weeks last quarter to 160 to 180 weeks this quarter. An additional full year added in 90 days. A new order placed today arrives in Q4 2029. Solar turbine lead times followed: 102 to 106 weeks in Q4, 146 to 150 weeks in Q1.
This is not a temporary disruption. This is Caterpillar structurally reallocating production capacity toward power generation, where a single customer (Microsoft, Google, Meta) signs a contract worth more than the entire annual output of the compression aftermarket. The compression industry became a price-taker in its own supply chain, and the price is set by a hyperscaler whose cost of downtime is denominated in lost AI training runs rather than deferred production.
(Next week, I am publishing what might be the most fun piece I have written for this newsletter: a complete breakdown of Caterpillar, their supplier network, and a bottoms-up supply side model of where the engines are actually going. The lead time number is the symptom. The model is the diagnosis.)
The quarterly scorecard reflects the downstream consequence.
Archrock
$24.27/HP/month (up 8% YoY). Contract ops margin at 72%, highest clean quarterly record. EBITDA $221 million. Utilization 95%. Leverage 2.6x. CFO Doug Aron retiring by year-end.
Kodiak
$23.31/HP/month (up 3.7% YoY), targeting $24 by year-end. Contract services margin at 70.6%, seventh consecutive quarterly record. EBITDA $190 million. Utilization 98%. 10-year contract extension signed with a top customer (unprecedented in the industry). Zero share repurchases.
USA Compression
$22.73/HP/month (up 8% YoY; 4.7% from J-W accretive mix, 3.2% organic). EBITDA $188.6 million, company record. Utilization 91.9%, diluted by 200,000 HP of J-W idle inventory. Leverage 3.74x, hitting the 3.75x target a quarter early. 2026 new HP now 90%+ contracted, up from 50% at Q4.
Blended
$23.44 average revenue per HP per month. 95% average utilization. 69% average adjusted gross margin. All at or near record levels.
In Q4, I told you to quote Brad Childers’ earnings call language in every negotiation. “Your CEO told investors the industry has caught up with inflation.” We called it the comp. We said to use it like a real estate agent uses a below-asking sale.
That weapon lasted 90 days.
Childers’ Q1 tone shifted. No more “more modest.” Instead: “very happy with overall pricing in the market.” Revenue per HP per month moved higher sequentially and year over year, contradicting the Q4 moderation signal. KGS went further. Mickey McKee stated pricing power “will continue to 2027 and beyond.” Supply chain physics overwrote the earnings call narrative in a single quarter. Cat lead times added a full year. The supply constraint that underpins pricing power got dramatically worse between Q4 and Q1.
The lesson is not “find a new quote.” The lesson is: stop anchoring to vendor rhetoric entirely. Earnings call language is a lagging indicator with a 90-day shelf life. Lead times are the leading indicator. And lead times just told you the supply response is not coming before 2029.
The Bifurcation
There is a number in KGS’s Q1 filing that tells you more about the next two years of compression negotiations than anything management said on the earnings call.
Month-to-month horsepower exposure jumped from 9% of fleet in Q4 to 14% in Q1. A 500 basis point increase in a single quarter. That is 615,000 HP now operating on contractually renewable terms, up from roughly 400,000 HP three months ago.
In the same quarter, KGS signed a 10-year compression services contract extension with a top customer. The longest primary term ever disclosed in the contract compression industry. A second 10-year extension is in process.
These two facts are only reconcilable if the customer base is splitting in two.
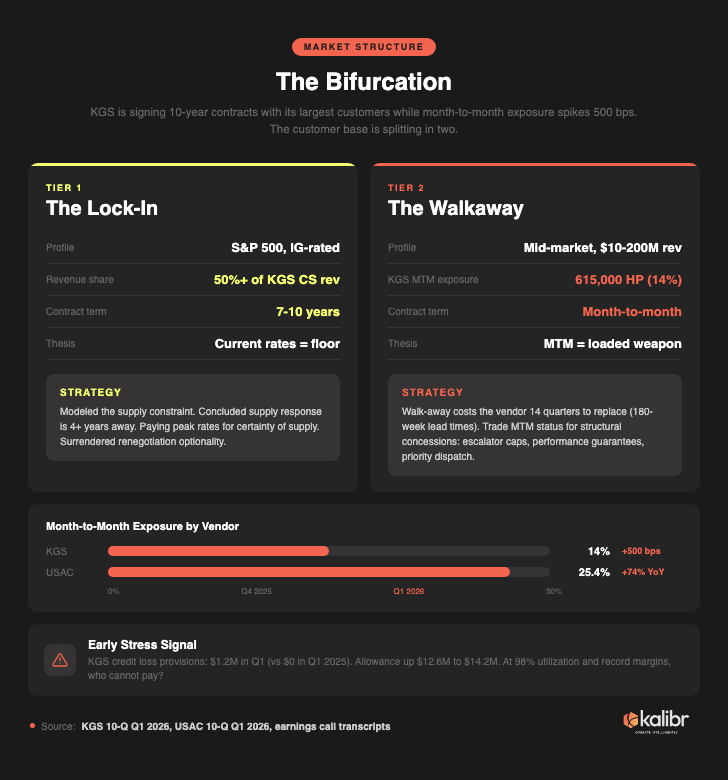
Tier 1: The Lock-In.
The top 10 KGS customers (S&P 500 constituents, investment-grade credits, 50%+ of contract services revenue) are voluntarily locking in 7 to 10-year terms at peak-cycle rates. These are not naive counterparties. They have modeled the supply constraint. They have concluded that current rates are the floor, not the ceiling, because the supply response is 4+ years away and the engines that would build new units are going to data centers. Certainty of supply at current rates beats the optionality of going short when the alternative is a 3.5-year wait for replacement equipment.
Tier 2: The Walkaway.
Mid-market operators are rolling off primary terms and not re-upping at the terms offered. They are going month-to-month. That 615,000 HP on MTM at 98% utilization is not idle iron. These are operating units generating revenue. The operators attached to those units are choosing short-term flexibility over long-term commitment. Some cannot commit because their planning horizon does not extend to 2033. Some are balking at the rate. Some are simply declining to sign paperwork.
USAC tells the same story from a different angle. Month-to-month revenue now represents 25.4% of contract operations revenue ($78.5 million in Q1), a 74% increase year over year. The highest MTM exposure in the sector.
And there is a third signal, quieter but worth noting. KGS booked $1.2 million in credit loss provisions in Q1, up from zero in Q1 2025. The allowance for credit losses rose from $12.6 million to $14.2 million. At 98% utilization and record margins, who cannot pay?
Here is why this matters for your next negotiation, and why Tier 2 is the better position to be in right now.