


Nominally Hedged is Kalibr Partners’ briefing on what oil and gas actually costs: every category, CAPEX to OPEX, proprietary data systems, interpreted through a commercial lens. Whichever side of the negotiating table you sit on, you are the intended reader. The data is neutral: the iron does not change shape depending on who reads it. In any single engagement we sit on one side of the table, and we tell you which.
A compression vendor makes money when horsepower is set and earning. A drilling contractor makes money when rigs are turning, a frac company when crews are pumping, a tubular distributor when pipe is leaving the yard. Nobody would pay for that observation, and I’m not asking you to. But the entire commercial posture of the service sector hangs on the back half of those sentences: earning, turning, pumping, for somebody. The iron does not care who the somebody is. You’ll do. So will your neighbor.
Most operators prepare for a renewal as if the vendor’s decision is about them, so let’s run the standard preparation and watch it not matter.
Suppose you run 30 units in the Delaware with a compression renewal coming up in Q4, and you’ve done the homework the textbooks assign. You know your BATNA (Best Alternative to Negotiated Agreement) cold. You know what insourcing would cost (roughly a seven-year payout on new iron, which is why it’s a calculation you run and not a plan you execute). You know which competing vendors have idle units in your size class, and how long you could limp along on rentals if talks went badly. You walk in knowing exactly what you’ll do if they say no.
The regional VP across the table has a different spreadsheet open, and you’re not on it. It lists every other operator running his equipment in the basin: who’s adding rigs, who just closed a merger, who got upgraded to investment grade last month, who’s unhedged into a soft strip, whose board locked a multi-year program and said so on the call. If he were being candid, which he is paid specifically not to be, his side of the negotiation would go something like: “Hi. I like you. Your checks clear and your ops team doesn’t yell at my mechanics. But if you walk, this spreadsheet says your horsepower is set at somebody else’s tank battery inside a quarter, at the same rate, possibly with a mobilization fee thrown in for my trouble. So, the rate is the rate.” Notice that nothing in that speech is about you. Your homework never comes up.
The arithmetic underneath every deal we work is one line: your BATNA minus the vendor’s BATNA equals the zone of possible agreement. Operators are, in my experience, genuinely good at the first term and almost never analyze the second. And the second term has two components that get conflated. One is the vendor’s own economics: debt pressure, idle inventory carrying cost, contract expiration cliffs, spot-versus-legacy tariff spread, fund lifecycle if he’s PE-backed. We score that on an 11-dimension Leverage Matrix, per basin rather than per vendor, because the same company that shrugs you off in Midland, where it keeps 65% of its fleet, will bend in the Powder River, where it keeps less than 5%. That component you can read out of a 10-K if you know where the bodies are buried.
The other component is the vendor’s alternatives, and the part that took me embarrassingly long to internalize is that it isn’t a fact about the vendor at all. It’s a fact about your neighbors. The thing that lets him quote “the rate is the rate” with a straight face is the aggregate durability of everyone else’s demand. For years this was the fuzziest number in our whole system. We could read a vendor’s covenants down to the footnotes and still be guessing about the order book standing behind him.
Game theory has had a name for this problem since before horizontal drilling existed. Lloyd Shapley eventually got a Nobel for asking what each member of a group is actually worth when the group creates value together, and the classroom example is gloves. You own a left glove. Two strangers each own a right glove. A pair sells for $100; singles sell for nothing. Average over every order the three of you could arrive and credit each arrival with the value they add at that moment, and the split comes out $66.67 for the left glove, $16.67 for each right. (I would have guessed something like 50/25/25 before running the orderings myself, which is rather the point. Value doesn’t split by contribution to the pair. It splits by scarcity within the group.) Neither right glove got worse. There were just two of them.
A vendor’s book of business is the coalition. He brings the iron, you and every operator around you bring demand, and the value on the table is the utilization the book supports, which in a levered rental business is a solvency metric wearing a performance metric’s clothes. Your rate, your allocation priority, your place in the queue when a 2,500-horsepower package frees up: all of it is a Shapley split being computed slowly, by feel, by regional sales VPs who have never heard of Lloyd Shapley but can tell you to the unit how many right gloves are in their basin. Diamondback’s rig count is in your negotiation whether you invited it or not.
So the second term of the BATNA equation is measurable after all. It just isn’t measurable by studying the vendor. You have to study everyone else’s demand: nominal, relative to yours, scored for durability, across every basin the vendor could redeploy into. That’s what the Activity Resilience Index does. And because vendors already run this ranking informally (every allocation decision of the 2022-through-2024 scarcity was one, made by feel, and mostly made correctly), the same index read from the other chair is a targeting model: which customers to bank on, which to paper up with term before they wobble. This quarter we read every Q1 2026 earnings call in a 60-plus company universe and scored them all.
An Index That Only Moves When Someone Talks
The ARI answers one question per operator: how likely is this company to keep buying oilfield goods and services at or above current levels for the next 24 months? It’s deliberately service-agnostic, because a rig drop cancels the drilling contract, the frac crew, the sand, the water, and eventually the compression expansion all at once. The unit of analysis is the drilling program, not any line item hanging off it.
Seven dimensions, each scored 1 to 10, weighted by how directly they control that answer. Capital commitment durability and financial capacity carry the most weight, because activity dies in exactly two ways, by decision or by force, and those are the two gauges. Inventory depth and hedging come next: inventory tells you whether the program can physically continue, hedging tells you whether the drilling decision is coupled to the strip or insulated from it. Basin economics, operational momentum, and management signaling round out the seven. (The exact weights are ours.) Signaling earns a slot in a quantitative model because tone leads capital by one to two quarters; a CEO who starts saying “flexibility” in February drops the rig in June. The composite bands: 8.0 and above is fortress demand, the kind a vendor’s board will underwrite a fleet expansion against. 6.0 to 7.9 is durable. 4.0 to 5.9 is at risk. Below that, nobody should be underwriting anything against you.
Two mechanical details do most of the work. The index only rescores a company when it files a new earnings call, investor day, or special call; no new information, no new score. That’s the correct cadence for a measure built on management’s own commitments, and it makes the quarter-over-quarter delta the tradeable part, because a falling score is a procurement window with a date on it. And company scores aggregate to a basin score weighted by rig share, and the basin score is the number that prices your deal. Rising basin ARI: the coalition around you is strengthening and your marginal contribution is shrinking. Falling: your volume is becoming the difference between the vendor’s fleet working and the vendor’s fleet parking.
This is, bluntly, an information asymmetry trade. The vendor knows his book; he lives in it. The point of scoring the public tape is that his read of the basin stops being privileged. Forty-six companies triggered rescores this season. Here’s what came out.
The Quarter Everyone Got Stronger
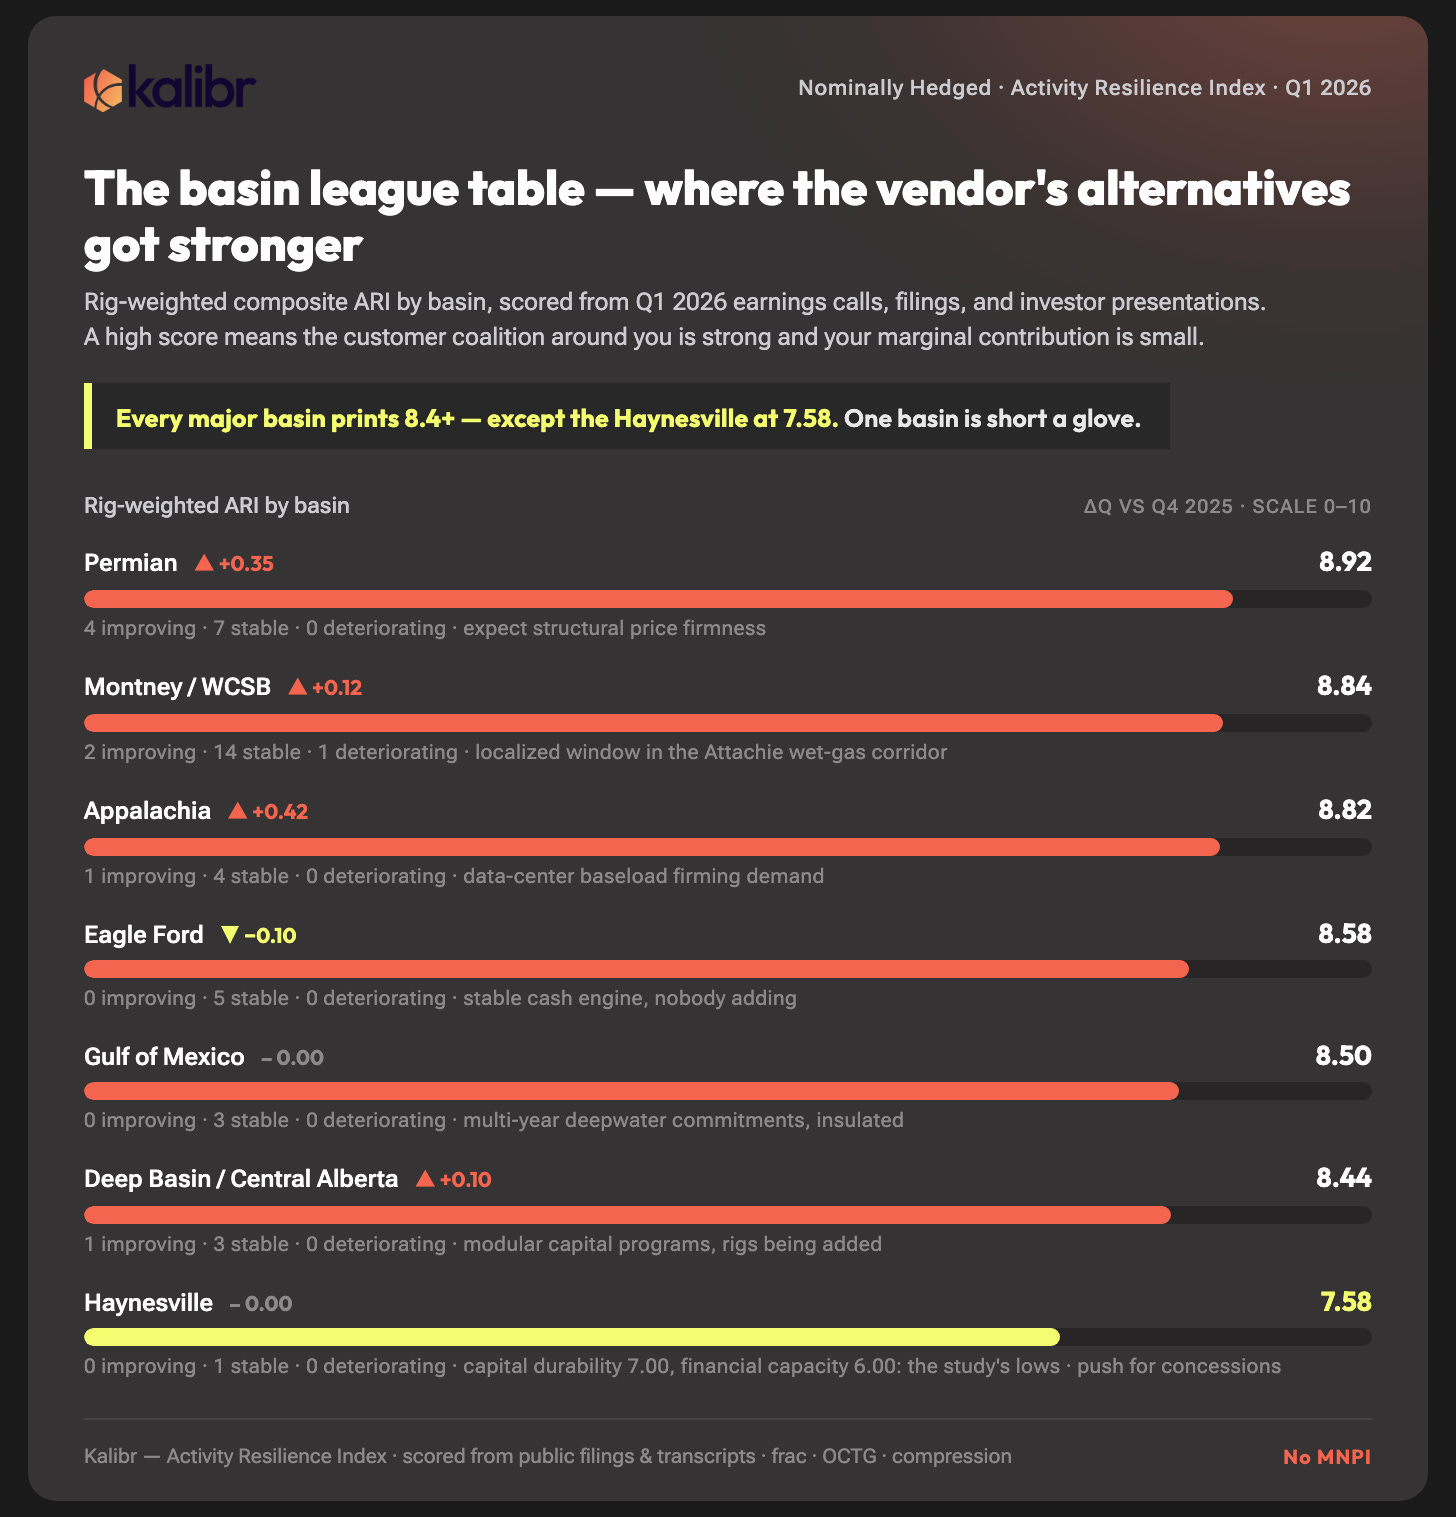
The Permian sits at 8.92, up 0.35 on the quarter, with four companies improving, seven stable, and zero deteriorating. Breakevens of $25 to $35 per barrel and consolidator balance sheets have produced a customer base that vendors of every stripe can underwrite expansion against, and they will. If you’re negotiating anything in the Delaware right now, compression, rigs, sand, your counterparty’s alternatives have never scored higher. (Is that the strongest vendor position in the modern history of the basin? I don’t know, man, the tape only goes back so far. It’s the strongest since anyone’s been scoring it.)
Appalachia is the quarter’s biggest gainer at 8.82, up 0.42, and the mechanism is a demand regime change rather than a price call. CNX and Range carry hedge books above 60%, and the basin is rotating from seasonal price speculation toward baseload contracts feeding data centers and utility-scale power. EQT curtailing 10 to 15 Bcf in Q2 to protect pricing reads, in this frame, as discipline rather than distress. The gas is sold before it’s drilled, which makes the drilling very hard to talk yourself out of.
The Montney and broader WCSB print 8.84, up 0.12, with the deepest stable cohort in the study, fourteen companies. The story is takeaway: Trans Mountain’s 590,000 barrels a day of new egress and LNG Canada’s 2.0 Bcf/d of processing turned a landlocked resource into an export business, and reserve life north of 15 years did the rest. The Eagle Ford (8.58, down 0.10) and the deepwater Gulf (8.50, flat) are stable for opposite reasons: deepwater capital is committed years ahead and doesn’t react to the strip, while the Eagle Ford is a cash engine that diversified owners like ConocoPhillips and Murphy harvest to fund growth elsewhere. Steady, but nobody’s adding.
Then there’s the Haynesville, at 7.58 the weakest major play in the table, with capital durability at 7.00 and financial capacity at 6.00, the two lowest dimension scores anywhere in the study. Pure-play gas operators there are absorbing severe margin compression, and Comstock’s leverage and capital deficit mean the plan flexes with the basis; flexes, in the bad case, into rig drops. It’s the one basin in the table where the scarce glove is on the operator’s hand.
The mid-quarter runs also caught three basins outside the quarter-end table deteriorating: the Bakken at 5.85 (down 0.60, on structural productivity decline), the DJ at 5.35 (down 0.55), and the PRB at 4.75 (down 0.65). Coverage there is thinner and the reads are noisier, but the direction is consistent, and every vendor selling into those basins can feel it without a model.
The Improvers Didn’t Add a Single Rig (Q1)
Seven companies moved more than a full point this quarter, six up and one down, and you could tell the up story as six unrelated pieces of good news:
Devon closed the Coterra merger and came out at 0.90x pro forma net leverage with expanded buyback capacity. Up 1.25 points, 7.73 to 8.98.
Antero integrated the HG acquisition and collected its first investment-grade rating. Up 1.18.
Tamarack Valley sold Charlie Lake and turned into a debt-free Clearwater pure-play. Up 1.15.
SM Energy retired its most expensive debt with a $950 million South Texas divestiture. Up 1.15.
Ovintiv integrated NuVista with net leverage under 0.80x. Up 1.08.
Permian Resources landed a triple investment-grade rating with well costs down to $685 per lateral foot. Up 1.05.
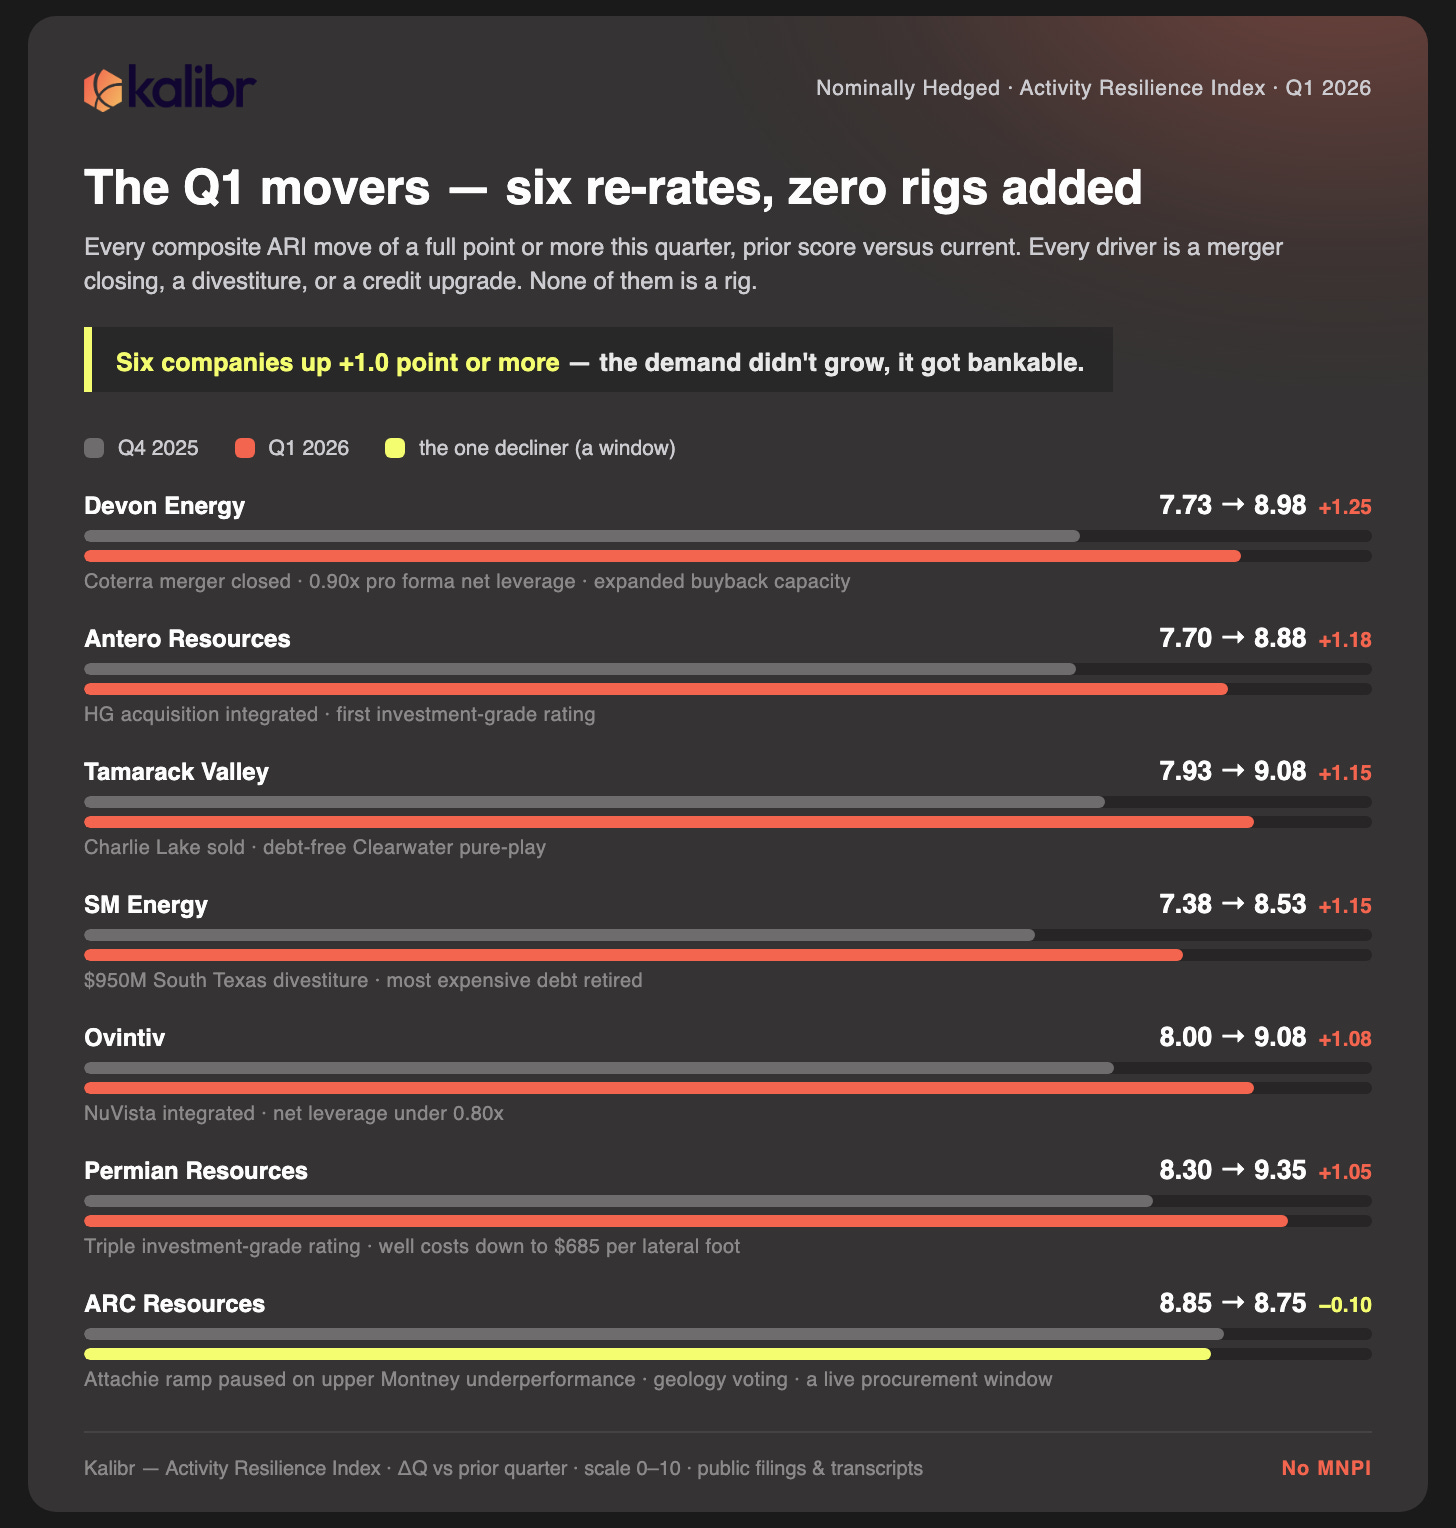
Now count the rigs in that list. There aren’t any.
So one available reading of the quarter is that nothing happened: same rigs, same volumes, some paper got shuffled, fine. The more informative reading is that the thing vendors actually price moved a lot. The quantity of demand barely budged; what moved is how much of it a vendor’s board, or a vendor’s lender, will believe. An investment-grade consolidator levered under 1.0x is demand you can underwrite a fleet expansion against; the same rigs run by a stretched single-basin operator are a hope with a decline curve. Q1 2026 converted a large block of North American drilling from demand vendors wished for into demand they can bank, and in the gloves game this is the quiet move where the right gloves organize. Your program is exactly what it was in March. Your marginal contribution fell anyway, because the demand around you got more certain.
Consolidation deserves its own line, because it transfers negotiating power twice. When Devon absorbs Coterra, the basin’s aggregate demand gets more durable, which strengthens every vendor’s hand. And the combined company becomes a much larger share of any single vendor’s book, which strengthens Devon’s hand. If you’re a 20-unit independent in the Delaware, both transfers came out of your side of the table, at closings you were not invited to. I mean, congratulations to everyone involved.
The one decliner is geology voting. ARC slipped 0.10 after upper Montney wells at Attachie underperformed and management paused the ramp to re-evaluate, which makes the Attachie corridor the only soft demand in an otherwise firm WCSB. Small number, real window, and somebody in the wet-gas corridor is going to get a discount out of it.
Where Your Volume Still Matters
For operating teams, the playbook falls straight out of the table, and it applies to the whole service stack, not just our corner of it.
In the Permian, Appalachia, and the WCSB, your marginal contribution is shrinking, so stop negotiating like it isn’t. Asking for rate cuts in an 8.9 basin is asking the landlord to mark down the building; in compression especially, the rate is the vendor’s book value, and he’ll hold it because his auditors and his covenants require him to. Lock allocation early, take the term, and extract value where it doesn’t reprice the asset: mobilization credits, guaranteed response times, spare-part consignment, performance clauses with teeth. The same logic runs for rig lines and frac calendars, where the concession currency is crew quality and schedule priority rather than steel. Should the insourcing math still be in your prep? Yes, obviously; the calculation is the BATNA even when the execution isn’t. Will it move the rate in an 8.9 basin? It will not.
In the Haynesville, and in the Bakken, DJ, and PRB if the mid-quarter reads hold, you are the utilization. Act like it: spot pricing, structural discounts, extended payment terms, consignment inventory. The mid-quarter runs caught Appalachian operators playing the same hand from the other side, timing completions around weak price windows and taking cost concessions across nearly the whole vendor list. Leverage is perishable, and in a falling basin every quarter you wait to renegotiate costs the vendor more than it costs you. Both sides’ models know it.
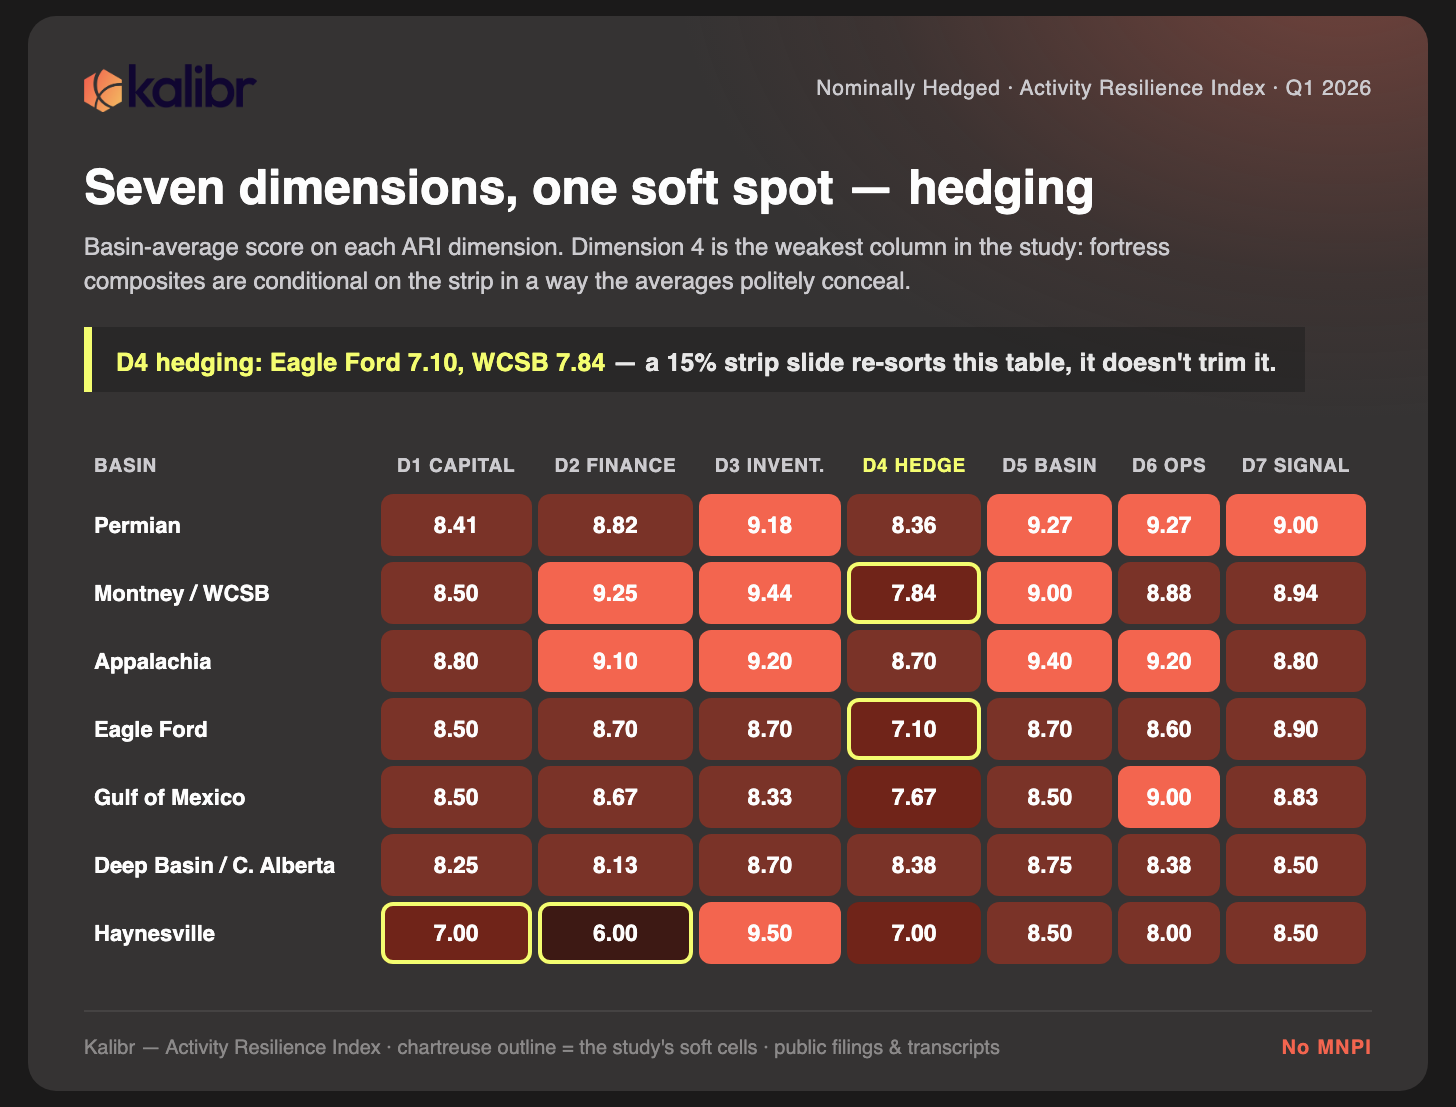
And everywhere: watch dimension four. Hedging is the soft spot of the entire study. The Permian averages 8.36 on it, the WCSB 7.84, the Eagle Ford just 7.10. Magnolia scores 6.50 because it chooses to run unhedged; Murphy’s 5.00 is the lowest hedge score in the table. Tourmaline has already built the option, a $200 million deferral that lets it pause completions and push out up to 60% of well costs if AECO stays weak. Fortress scores are conditional on the strip in a way the composite politely averages away.
For vendors and their investors, the same table read upside down is a targeting model, and this holds whether you rent horsepower, rigs, or crews. Rank your book by ARI. The 8.5-and-above names get allocation priority and your best iron, because their demand is what you take to your board. The fragile tail gets term-length protection, not handshakes. And weight dimension seven more than feels natural, because the customer who starts saying “optionality” on calls is telling you, two quarters early, what the renewal conversation is going to sound like.
Casing Doesn’t Do Investor Relations
A fair objection to all of the above: ARI is built from the tape, and the tape is talk. Management signaling leads activity by a quarter or two, which is exactly why we score it, but managements also spin, and a score assembled from earnings calls inherits whatever optimism survived the general counsel’s markup. You know this. You’ve helped draft the language. If you wanted to know what a basin is actually doing, as opposed to what it’s telling analysts it plans to do, you wouldn’t listen. You’d watch the steel.
The steel is the other half of the system, and the half this article isn’t giving away. Kalibr’s data subscription tracks the physical layer of the same demand ARI scores financially, and the coverage runs to roughly 80% of a drilling program’s CAPEX and 80% of its OPEX. (Pareto would approve.) Three streams do most of the work.
Casing demand, by string. Rig count was a fine demand proxy when a rig meant a predictable number of wells, and that world is gone: laterals stretched past three miles, cycle times fall every quarter, and one modern rig does the work 2014 assigned to three. Casing feet by string is the unit of development that efficiency can’t deflate, because every lateral foot gets cased whether the rig count rose or fell. Track it by area and you’re watching production centers form before anyone writes a press release about them.
Frac performance, at the vendor fleet level. Fleet count has the same disease rig count has (simulfrac and e-fleets mean fewer fleets complete more wells), so throughput per fleet, per vendor, is the number that tells you how much production is actually coming online. Read the other way, it tells you which pumper’s calendar is genuinely full and which one is quoting confidence, which is the vendor-BATNA question again, answered in stages instead of statements.
Compression mapping. Once production exists it has to move, and horsepower is where volumes declare themselves. Map the compression and you’re mapping the flow: which gathering corridors are filling, which are saturating, where the next bottleneck forms and who’ll be paying for it.
One more thing about those streams, mentioned quietly because it’s the practical part: the steel comes with names on it. Casing tracks to who sold it, frac throughput to whose fleet pumped it, horsepower to whose nameplate is on the package. So the physical layer is more than a map of the basin. It’s a map of who does business with whom, in every one of those categories. You’ll remember the regional VP’s spreadsheet from the top of this piece, the one listing every other operator in his book, the one you’re not on. The pairing data is, functionally, that spreadsheet, except it also covers the books of every vendor he competes with. What you’d do with that at a renewal I’ll leave to you.
Each of these is a major cost center first, and the line items justify the read on their own. Stack the three and you get a map with a time axis: casing shows where production is heading, frac shows how much is coming, compression shows where it’ll flow. ARI tells you what a basin says it will do; the steel tells you what it’s already doing; the interesting negotiations live in the gap between the two. I genuinely don’t know how many of your counterparties are watching both sides of that gap. My guess is one or two of the large ones, imperfectly. If you’d rather be on the better-informed end of that particular asymmetry for once, the score in this article is the free half of the pairing, and the reply button covers the other half.
The Crowded Top of the Table
Anyway, the delivery mechanics. Kalibr runs the ARI on an earnings-call gate: a company files a transcript, the score updates, the basin aggregates recompute, and anything moving a full point gets flagged the same week. Subscribers get the rescores as they happen, the full dimension-level scorecard each quarter translated into basin-by-basin negotiating posture, and the physical-layer read alongside it. This quarter’s full table, all 46 companies, all seven dimensions, ships with this issue.
What nags at me is the top of the table. Forty-two of the 46 companies sit in the fortress band, 8.0 or above. EOG tops the list at 9.46, and even the bottom of the table would have looked enviable three years ago. Is that a golden age of customer quality? If you sit on a vendor’s board, sure, and vendor boards are acting like it. Is it also exactly what a table built partly on half-hedged books would print at this point in the strip? Also yes. The crowd’s weakest dimension is hedging, which means a 15% slide in the strip wouldn’t trim this table so much as re-sort it, and next quarter’s movers list would fill with names heading the other direction. Whether today’s scores are a durable regime or a high-water mark isn’t something the current filings can tell you. The next earnings-call gate opens in October. We’ll run the tape and find out.
Nominally Hedged is published by Kalibr Partners. Reply, or message us directly, and we will point you to the report built for your side of the table: the quarterly ARI scorecard for operators, the customer-durability targeting read for compression and oilfield service vendors.
This newsletter is research and commentary for informational purposes only. It is not investment advice and not a solicitation to buy or sell any security. The analysis draws on public filings, earnings call transcripts, and investor presentations alongside Kalibr’s proprietary scoring framework; figures are believed reliable but not guaranteed, and reflect modeling assumptions described in the piece. Company names and marks belong to their respective owners.