


Nominally Hedged is Kalibr Partners’ briefing on what oil and gas actually costs: every category, CAPEX to OPEX, proprietary data systems, interpreted through a commercial lens. Whichever side of the negotiating table you sit on, you are the intended reader. The data is neutral: the iron does not change shape depending on who reads it. In any single engagement we sit on one side of the table, and we tell you which.
July is Kalibr’s free preview month. Paid proprietary starts back up in full force in August with an enhanced deliver schedule.
I keep a small collection of soapboxes. The one I climb most often is about data, and it goes like this: the more data-centric oil and gas becomes, the worse we seem to get at making decisions with it. Every year the datasets get bigger, the dashboards multiply, and now we’re stacking AI models on top of all of it without ever installing the thing that makes data useful, which is a governing lens for what decision the data is supposed to feed. Zoom all the way out and data has exactly one job in this industry: helping us make risk-based, probabilistic decisions. Which wells to drill. Which assets to buy. Which vendors to pick. Everything else is decoration.
The worst offender is the category I think of as commercial market intelligence, the data you buy to make purchasing decisions if you’re an E&P, or selling decisions if you’re a service company. I affectionately call most of what gets sold under this banner trivia facts. It is genuinely wonderful to know how your chemical spend benchmarks against your peer group. It is also useless in a negotiation, because you can’t walk into a vendor’s office and say Company X pays this, so we want to pay that. You’ll receive several thoughtful, well-constructed reasons why that number doesn’t apply to you, the meeting will end politely, and nothing will change. A price report can tell you where 5.5-inch casing trades on the spot market this week, which is a fact, and a fine one. But what does that fact do for a major that accounts for 15% of US 5.5-inch demand and wants to lock term? (Term, not to detour, is the single most treasured deal item in all of oilfield services, because it buys the one thing a service company cannot manufacture for itself: revenue stability. If you have granted a vendor term and then benchmarked the price to a spot index, call me. I have a speech.)
The problem underneath all of this is sequence. We gather data points and try to force decisions out of them. It should run the other way: start with the commercial decision you’re required to make (you have to pick somebody to run your compression), then the economic principles that govern that decision (usually game theory, occasionally just arithmetic), and only then go find the data that feeds it.
Run the sequence on compression, since that’s the chair we’re about to sit in. The decision is forced: wells don’t flow without compression, so somebody is getting picked. The governing principle is leverage: a vendor replaces 1% of its Bakken revenue a lot faster than it replaces 28%, so my importance to the incumbent is worth knowing precisely. And only now does the shopping list write itself: every unit in the basin tied to its vendor, the fleet’s primary-term expiry schedule, the 10-Qs and new-set velocity that say which weaknesses my business could offset in exchange for value coming back the other way. (We run the same sequence on OCTG and on frac. Different decisions, different principles, same order of operations.)
This is a hard discipline for E&Ps. It’s a brutal one for service companies, whose lower marginal returns leave a thinner budget for intelligence in the first place, and who then discover that nearly every product on the market was built for the other side of the table. So let’s run the exercise properly, from the seller’s chair, for a compression company.
The ATM Between the Reservoir and the Bank Account
Start with the two things the data has to give you, and notice that neither one is a benchmark.
First: with a finite sales organization, who do I target to create the most value? Second: once I’m in the room, do I have the data to prove the value case?
The second question gets all the product attention. The first one decides your year.
Because everything in a sales organization is relative, and everything has opportunity cost: every visit to one operator is a visit you didn’t make to another, and your two or three great closers can only be in so many rooms. Most compression targeting spends that scarce attention by proximity: the operator whose field super has your cell number, the account next to your yard, the one who answered last quarter’s email. Which is fishing where the boat happens to be anchored.
I left oil and gas for a while and worked commercial problems in a long list of industries that have nothing to do with a wellhead, and the thing you get for coming back is that the furniture stops being invisible. Compression is the strangest piece of furniture in the building. The compression fleet is the single most important set of machinery for an E&P’s cash flow (compression goes down, wells stop flowing, money stops arriving), and the industry’s standing arrangement is that this machinery belongs to somebody else. Not unheard of, as arrangements go: airlines lease their jet engines, and Amazon outsourced delivery right up until the economics said bring it home. But say the arrangement out loud and it tells you what the product is. A compression company operates the ATM standing between the reservoir and the bank account, and everything you sell is some version of that machine dispensing more reliably.
So say, for the sake of this exercise, that your differentiation is uptime. (Everyone claims great people and great equipment, which is exactly why neither is differentiation.) Uptime means more cash flow for your clients relative to what your competitors deliver. And if incremental cash flow is the product, your grading scale for accounts has to start with a simple question: who, relative to everyone else I could call on, needs cash flow the most?
The phrase carrying that question is “relative to everyone else,” because today’s E&P universe is broadly healthy. A decade of investor discipline, much of it prosecuted in public by Kimmeridge, means nobody is going bankrupt over an unoptimized compression schedule. But need is relative, and the tell is the capital stack. Debt load and maturity walls, hedge book, dividend yield, buyback posture, what management has promised whom: legible, public mechanisms for reading who, among healthy companies, is hungriest for the next dollar of operating cash flow. And in my experience the hunger comes in four recognizable shapes. Before we can price the shapes, though, we need to price the baseline, because the number your whole negotiation runs on is what the operator’s current arrangement actually costs.
The Invoice Is the Smallest Number in the Room
First, why this is worth pricing at all. Everybody knows the drilling story: the industry crushed drilling and completion costs, roughly 25% off the index since 2015. The part that gets less airtime is that lease operating expense came down maybe 5% over the same stretch. All the optimization went into building the wells and almost none into operating them. Compression is the largest controllable slice of what’s left, which means it’s where the remaining savings live, and where the motivation lives, on both sides of the table.
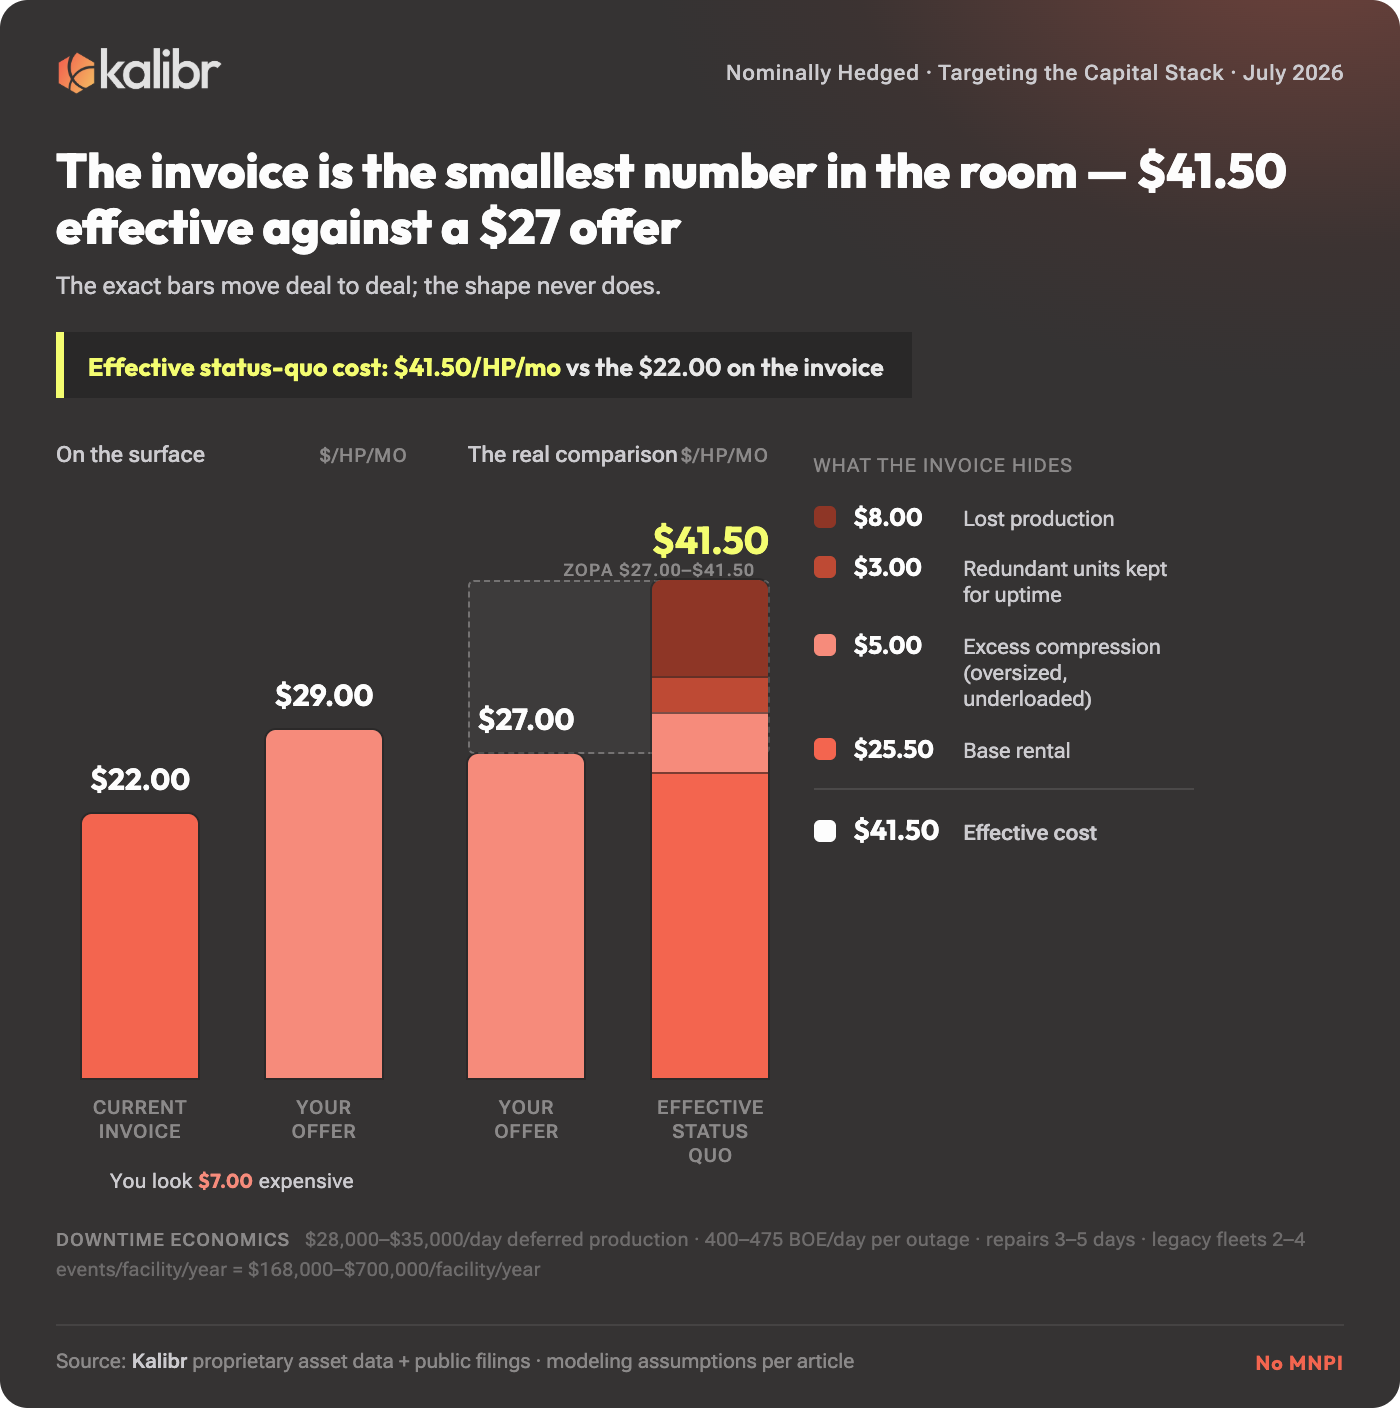
Now the negotiation frame. The operator’s alternative to dealing with you, their BATNA, is almost always the status quo: keep the units they have, from the vendors they have, at the rates they have plus a targeted increase. And every compression sales conversation goes to die in the same room, on the same two bars, with the same friendly speech. “We like you guys. We’re at $22 a horsepower. You’re at $29. I can’t take a $7 increase to my boss because your techs return phone calls. Send me something when the number moves.” It’s a fine speech. Every sentence of it is reasonable, and the whole thing rests on the smallest number in the room.
Because the current-cost bar is a lie of omission. The rental rate is the tip of the arrangement. Unplanned downtime on a single facility runs $28,000 to $35,000 per day in deferred production, 400 to 475 BOE per day per outage, and a standard repair window is three to five days. A legacy fleet takes two to four of those events per facility per year, which prices the downtime alone at $168,000 to $700,000 per facility annually. Add excess maintenance on 10-to-13-year-old iron, and the overhead of managing five-plus vendors nobody consolidated.
Quantify the whole arrangement on a representative fleet and the stack looks like this: $25.50 of base rental, $5.00 of excess compression (units oversized or underloaded for the current production profile), $3.00 of redundant units kept around to protect uptime, $8.00 of lost production. Call it $41.50 per horsepower per month effective, against a $27.00-class offer. (The exact bars move deal to deal; the shape never does.) The operator’s real alternative was never $22, and the zone of possible agreement is the gap between $41.50 and $27, which is enormous, which appears on no invoice anyone receives, and which it is somehow your job, as the seller, to introduce into a meeting the buyer is certain is about $22.
That $41.50 is the baseline: a healthy operator with no particular pressure, wasting money the ordinary way. The interesting accounts are the ones where the capital stack adds a fifth layer on top, because the fifth layer is where targeting lives.
Four Ways a Balance Sheet Gets Hungry
The fifth layer is different for different operators, and for the sake of this articles simplicity I will offer up four shapes I keep meeting: the securitized operator, the post-merger consolidator with a synergy number in public, the operator whose recycle ratio lags the basin, and the operator whose gas is committed to somewhere specific. Each shape amplifies the same compression waste into a different kind of pain: trapped equity, a broken promise to the street, a lagging multiple, penalty exposure. Walk through all four with real numbers, because the shape determines your opening line.
Shape One: Management Gets Paid Last
The newest shape, and the sharpest. It exists because private credit grew into a $2.1 trillion asset class by promising institutions yield and, less advertised, by making it hard to get your money back, and when it cracked (Blue Owl gated its $1.6 billion retail vehicle OBDC II in February 2026 after redemption requests jumped 200%), the capital rotated toward asset-based finance, hard collateral instead of corporate promises. One landing spot is upstream oil and gas. Annual upstream ABS issuance went from roughly $0.5 billion in 2020 to $4.3 billion in 2025, about $20 billion cumulative across 15-plus issuers, with spreads compressing from about 425 basis points to about 250 as life insurers became the anchor. Since 2023 the collateral has tilted oil-weighted, which pulls Permian and Mid-Continent packages, which is to say your accounts, into the conversation.
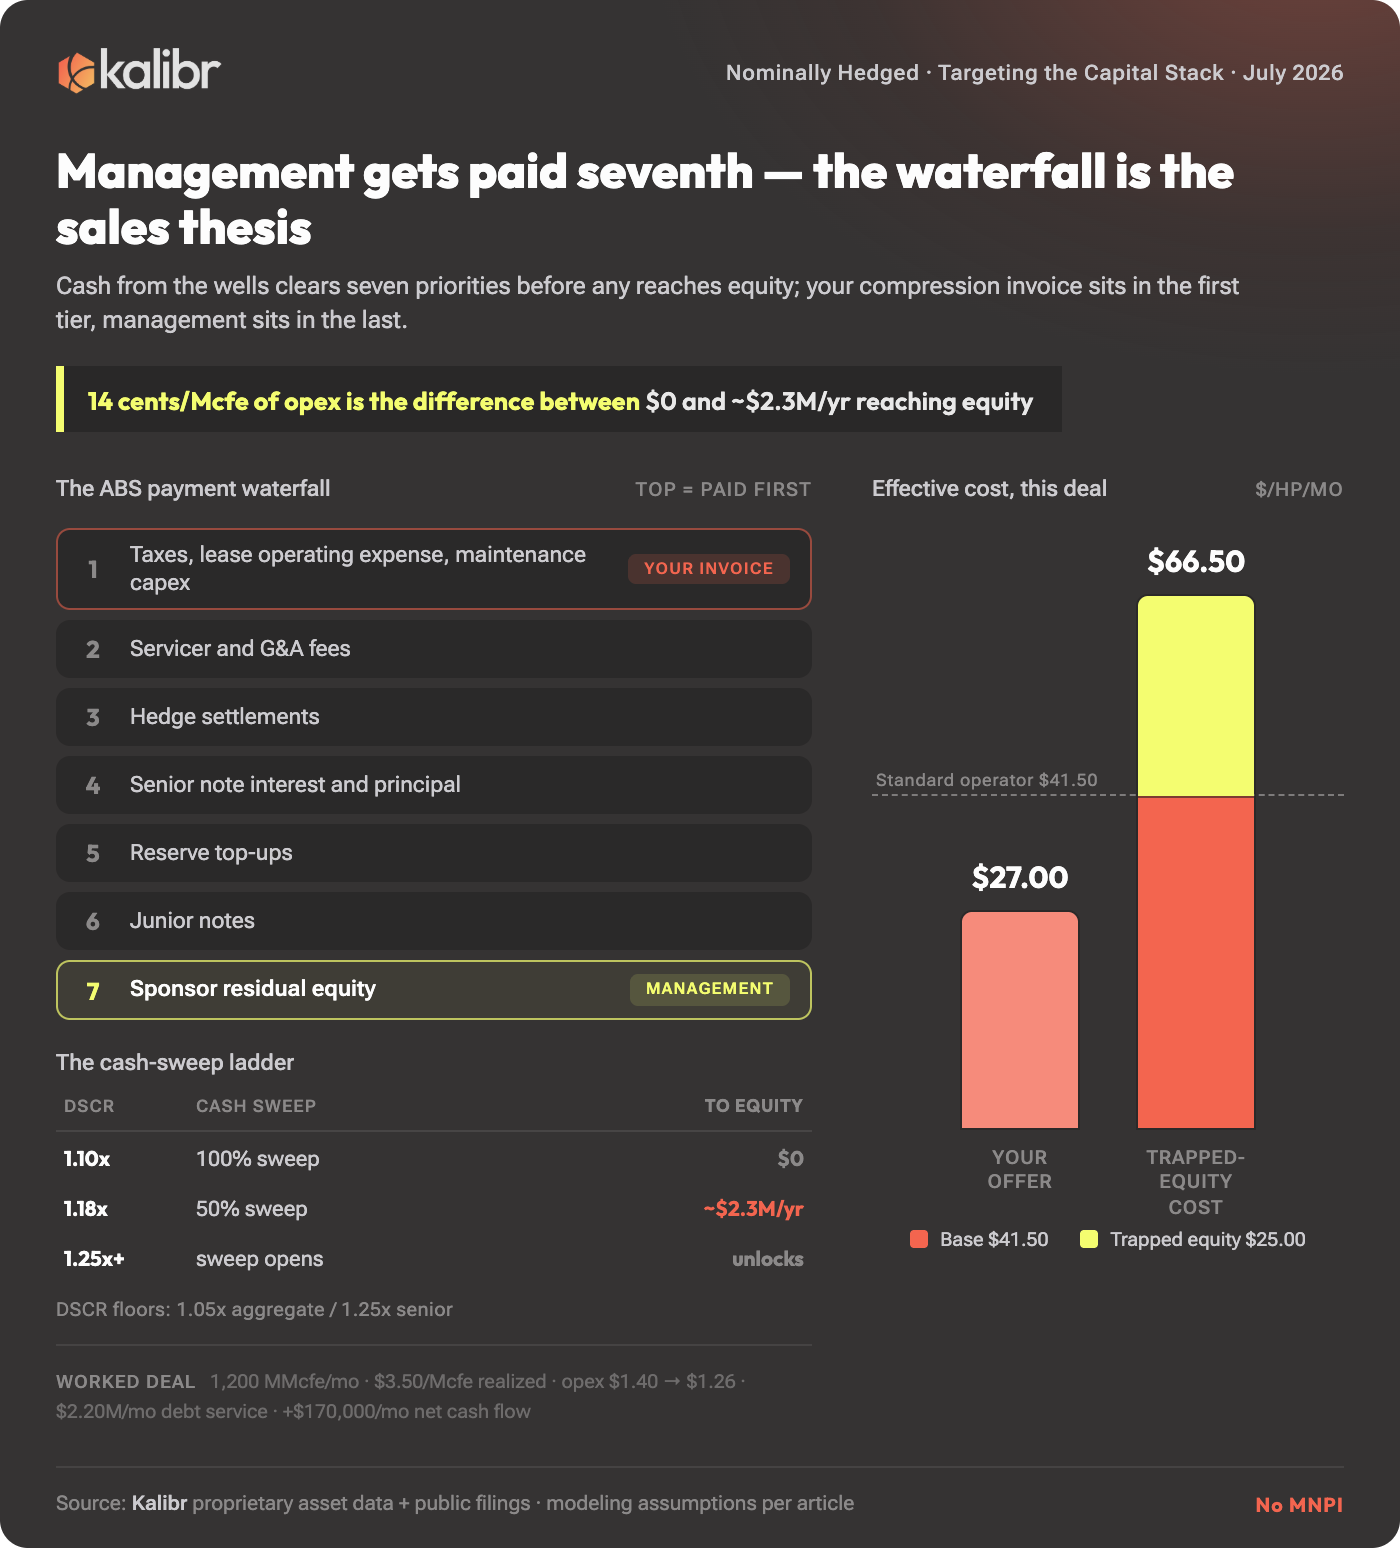
Here is what the structure does to your counterparty. Every month, every dollar the securitized wells produce lands in a locked account controlled by a trustee and pays out in a fixed order the operator cannot override: taxes, lease operating expense, and maintenance capex first, then servicer and G&A fees, then hedge settlements, then senior note interest and principal, then reserve top-ups, then the junior notes, and seventh, only what is left, the sponsor’s residual equity. Management is dead last in line. Seventh! The people who run the company collect after their own compressor rentals do, and that ordering is the entire lever: in an ABS, operating expense is a senior claim and equity is the residual. The structure pays the compression invoice before it pays the people who run the company.
If you sell cost reduction for a living (which I have the unfortunate or fortunate pleasure of doing, depending on the day), you have spent your whole career wishing somebody would invent a customer who is contractually obligated to care about your value proposition. You’d want the obligation written down, ideally in a bond indenture, ideally with a trustee enforcing it monthly. This sounds like a fantasy. The securitization market has been manufacturing exactly this customer since 2019.
The enforcement mechanism is the cash sweep. The structure watches a debt service coverage ratio against two floors, roughly 1.05x aggregate and 1.25x senior, and diverts the sponsor’s cash to accelerated note paydown as coverage degrades. Now the arithmetic I would tattoo on the arm of anyone selling into this shape. Take a representative deal: 1,200 MMcfe a month, $3.50 per Mcfe realized after hedges, $1.40 per Mcfe of operating cost, $2.20 million a month of debt service. Coverage comes out at 1.10x, and at 1.10x the sweep is 100% and the sponsor receives zero. Cut operating cost 10%, from $1.40 to $1.26, and net cash flow rises about $170,000 a month, coverage moves to 1.18x, and the sweep steps down to 50%. Is fourteen cents per Mcfe a big number? On a lease operating statement it’s a rounding note. Inside this structure it is the difference between $0 and roughly $2.3 million a year landing in the equity account, and for the people who run the company that makes it the whole number. I call this equity beta on cost control: a dollar of operating savings is worth more than a dollar inside the structure, because the waterfall carries it straight through coverage into residual equity.
Which is where you come in. Under an ABS, compression stops being a line item anyone can shrug about and becomes a covenant input. When Diversified Energy integrated Maverick, it pulled $150,000 a month of wellhead compression rentals out of the combined book, $1.8 million a year, and every dollar of it flowed down the waterfall into coverage and then into equity. The vendor who can credibly do that to an operator’s cost structure is not a vendor. He is an equity lever.
So the fifth layer for this shape is trapped equity, the residual the sweep is eating because the waste sits in the opex line, and it is the tallest fifth layer in the market: roughly $25.00 on top of the standard stack, for an effective status-quo cost around $66.50 per horsepower per month against a $27.00 offer.
Two more things about this shape. First, know who lives here: consolidators, not wildcatters. Diversified pioneered the structure in 2019 and has issued more than $3 billion; Jonah Energy has raised over $3 billion across seven issuances, including the largest single PDP securitization on record, $750 million in October 2022. There’s a second generation behind them: Goldman now warehouses acquisition debt for Presidio, up to $1 billion, while Presidio buys mature production, cuts operating costs about 47% in the first year, and terms the whole thing out into an investment-grade ABS. Securitized capital lets a buyer pay 105% to 112% of PV-10 where private equity clears 75% to 85%, so these sponsors are becoming the structural consolidators of North American PDP (Citi is reportedly circling behind Goldman), and the cost obsession is the return model itself, which is why a won account compounds: these operators buy again next quarter.
Second, the counterparty character. An ABS operator is boring by covenant: cost-disciplined, heavily hedged, DSCR-driven, contractually obliged to keep operating expense stable. If your pitch is premium equipment and hoping nobody audits the delta, this is the worst room you’ll ever walk into. If your pitch is documented cost reduction, there is no better customer in the market, because in an ABS somebody is always counting. And the counting extends to runtime: every day a unit sits down is revenue that never reaches the coverage test, so no operator in the market needs your uptime more than the one whose sweep is grading it monthly. The cleanest way in is usually parked in their own yard. Walk the fleet for older, underloaded engines and propose the swap, because right-sizing a unit loafing at half load on legacy iron is the fastest fourteen cents anyone will ever hand you, and the sponsor’s shortest path back out of the sweep. Then follow the capital: these sponsors buy mature production cheaper than anyone else can (Presidio, with the warehouse behind it, arguably cheapest of all right now), so they will keep buying, and the account you win on package one is pricing every package after it. (Honesty note: the structure is bulletproof right up until the cash flow underneath it isn’t, and the market knows it. So far the discipline has held: across the entire history of upstream ABS, the performance triggers have been breached exactly once, in the basis blowout after the 2022 Freeport LNG explosion.)
Shape Two: The Street Was Promised a Number
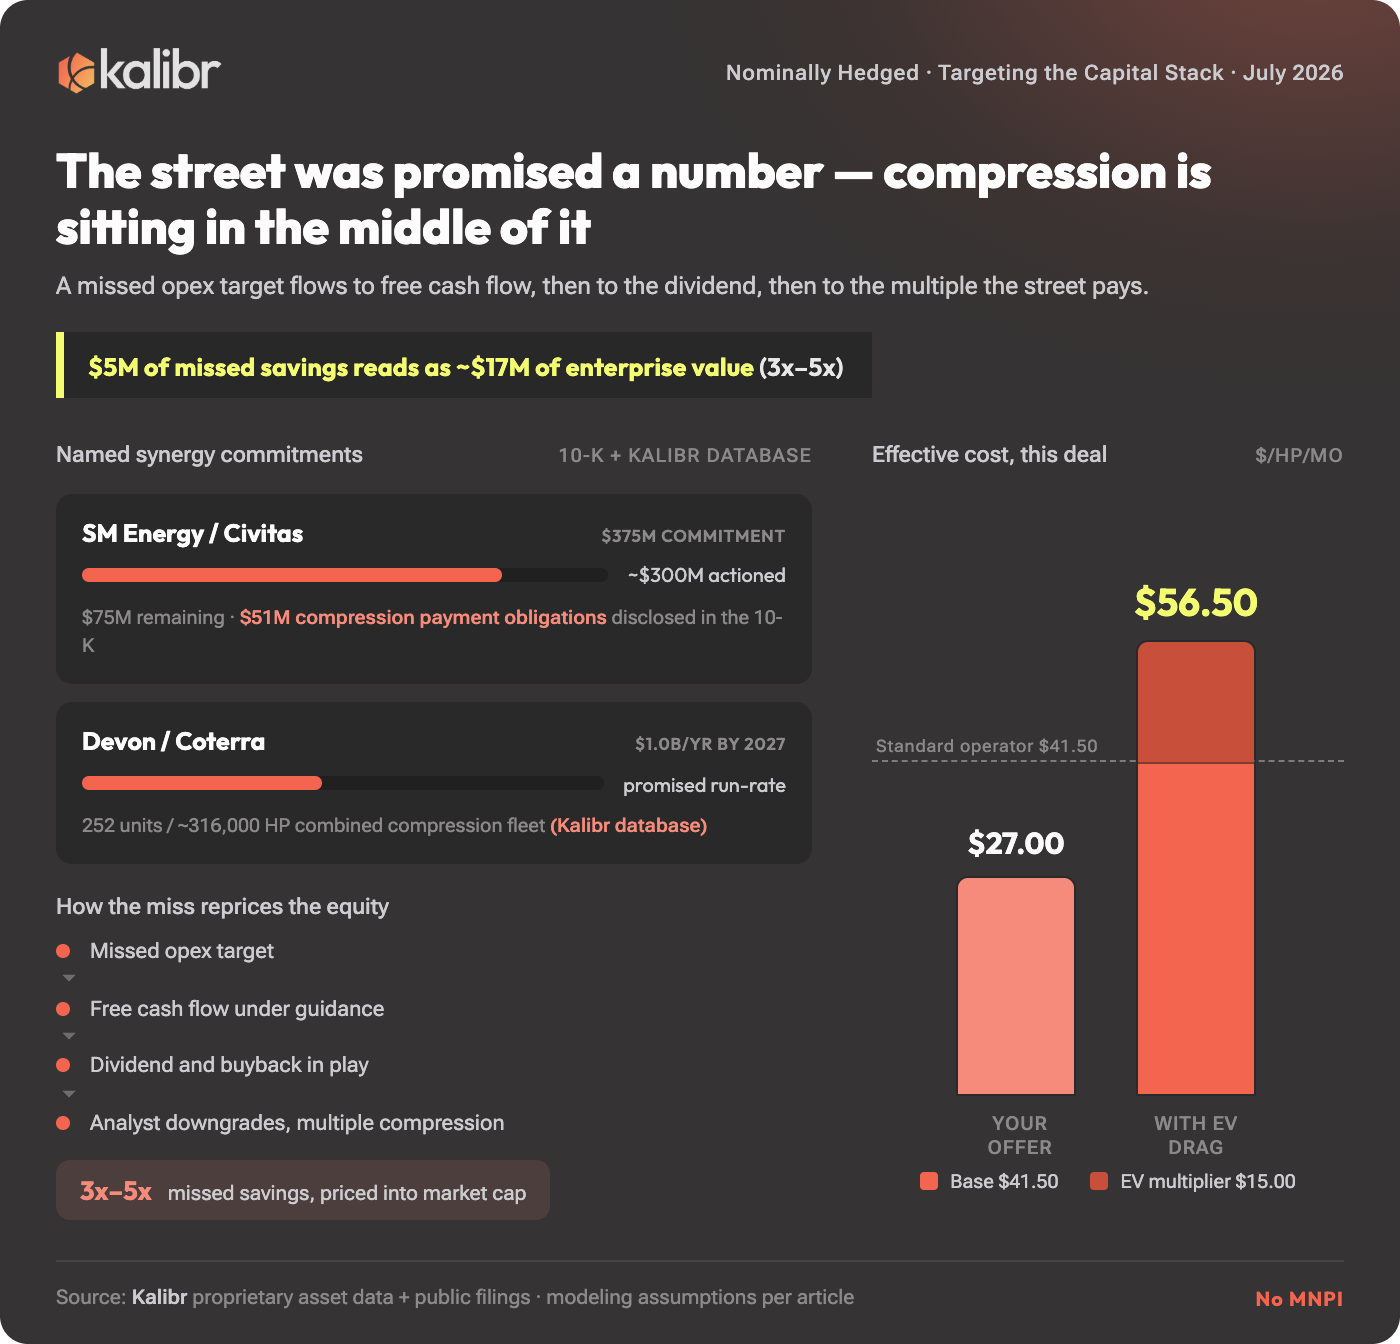
A merger closes, and management stands in front of the analyst community holding a synergy target. SM Energy absorbed Civitas against a $375 million commitment; roughly $300 million is actioned, which leaves $75 million that has to come from operational cost reduction, and the 10-K discloses $51 million in future compression payment obligations sitting right there in the middle of it. Devon and Coterra promised $1.0 billion a year by 2027; our database puts their combined compression fleet at 252 units and about 316,000 horsepower, a rationalization waiting for an owner.
The mechanism here is that a public synergy target converts compression waste from a cost into a broken promise. Unoptimized compression means a missed opex target. A missed opex target means free cash flow comes in under guidance. An FCF miss puts the dividend and the buyback in play, and dividend risk brings analyst downgrades and multiple compression. The market cap consequence runs 3x to 5x the missed savings: at the midpoint, $5 million of savings you failed to capture reads as roughly $17 million of enterprise value. So the fifth layer for this shape is the EV multiplier on missed savings, about $15.00 on the stack, for an effective status-quo cost around $56.50 against the same $27.00 offer.
What makes this shape a gift for a seller is that the pain is scheduled. Synergy targets have dates, integration teams have scorecards, and the street asks about progress on every call. Your proposal stops being a vendor pitch and becomes a named, sourced line item in the number they still owe the market. Compression is the lowest-hanging fruit on that ledger, and management already told the street which fruit they would pick.
Shape Three: Same Rock, Different Returns
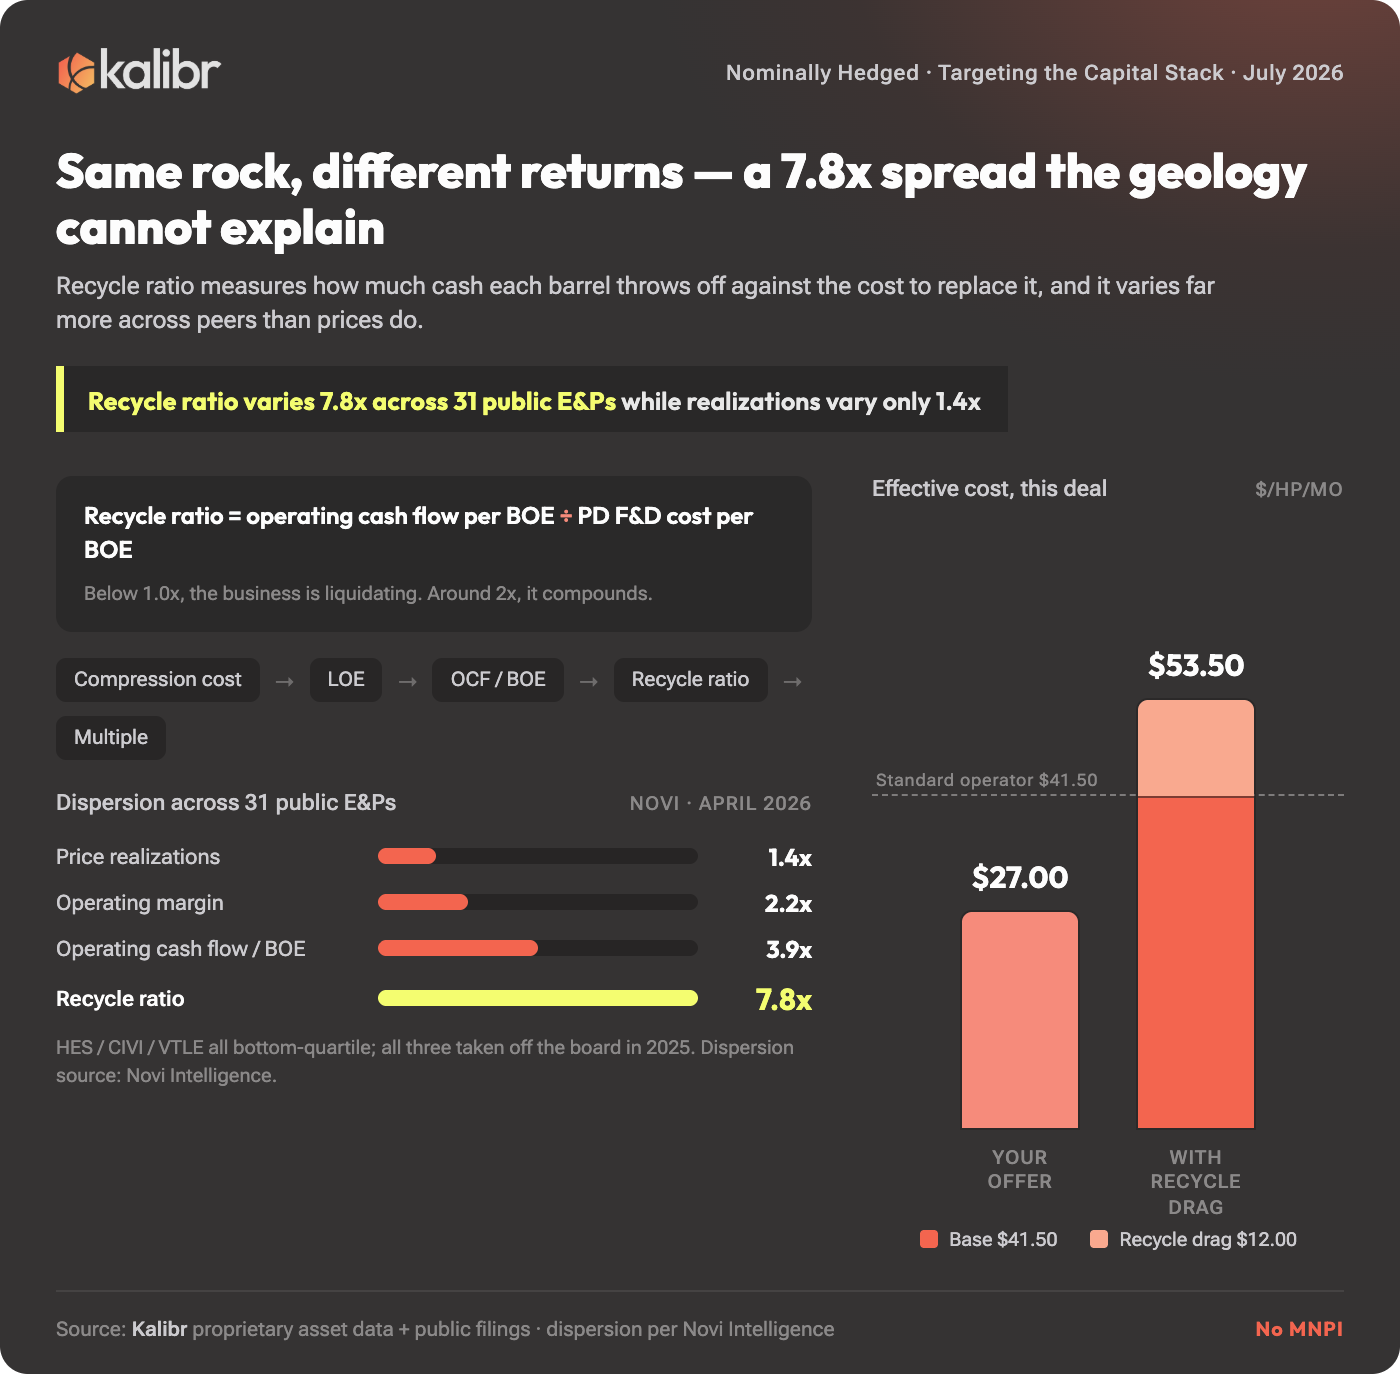
The quietest shape, and the one hiding in plain sight in every basin. The recycle ratio is operating cash flow per BOE divided by proved developed finding and development cost per BOE: how many dollars of cash a company generates for every dollar it spends replacing the barrel it just produced. Below 1.0x you are politely liquidating. Around 2x you compound.
Novi Intelligence ran the dispersion across 31 public E&Ps in April 2026 (I hand out compliments to other market intelligence shops approximately never; the Novi team has nothing but admiration from the folks at Kalibr), and the ladder is the story. Price realizations vary 1.4x across operators, which is mostly geology and marketing. Operating margin varies 2.2x. Operating cash flow per BOE varies 3.9x. And recycle ratio varies 7.8x. The rock does not explain a 7.8x spread; execution does. Top-quartile recycle ratios delivered the best 2025 share returns, bottom quartile the worst, and the three operators taken off the board in 2025, Hess, Civitas, and Vital, all sat in the bottom quartile. (Civitas appearing both here and in the previous section is not a coincidence. A bottom-quartile recycle ratio is how you become somebody’s synergy target. Again, another reason relativity matters. Everyone might be healthy, but big bank take little bank)
The chain from your product to their problem runs: compression cost into LOE, LOE into operating cash flow per BOE, cash flow into recycle ratio, recycle ratio into the multiple. An operator running above-peer LOE on the same rock as its neighbors has both room to cut and a board asking why the neighbors screen better. You can’t fix their rock, and neither can they. The operating-cost line is the one input on that slide anybody gets to move, and the fifth layer for this shape is recycle-ratio drag, call it $12.00 on the stack, for an effective status-quo cost around $53.50.
This is also the shape that gets you the CFO meeting instead of the field office. The conversation opens with the recycle ratio and the peer screen; horsepower shows up on slide four.
Shape Four: Gas With Somewhere to Be
Most operators sell into a market. Some sell into a contract. Caturus moves about 1 Bcfe a day toward the $13 billion Commonwealth LNG terminal under 20-year offtake agreements with Aramco, PETRONAS, and Glencore, and the minimum volume commitments in those agreements do not renegotiate because a compressor threw a rod in East Texas.
That changes the units of failure. For a standard operator, a day of compression downtime is $28,000 to $35,000 of deferred production, painful and recoverable. For the committed operator, the same day carries an MVC shortfall exposure we estimate at roughly $3 million at LNG-linked pricing. A legacy fleet averaging four days of downtime a year is carrying $12 million-plus of annual penalty exposure on top of the production it defers. At that scale the deferred production is a footnote in somebody’s monthly report. The story is the $3 million day, and it belongs to the CFO. The fifth layer for this shape is offtake penalty exposure, about $20.00 on the stack, for an effective status-quo cost around $61.50.
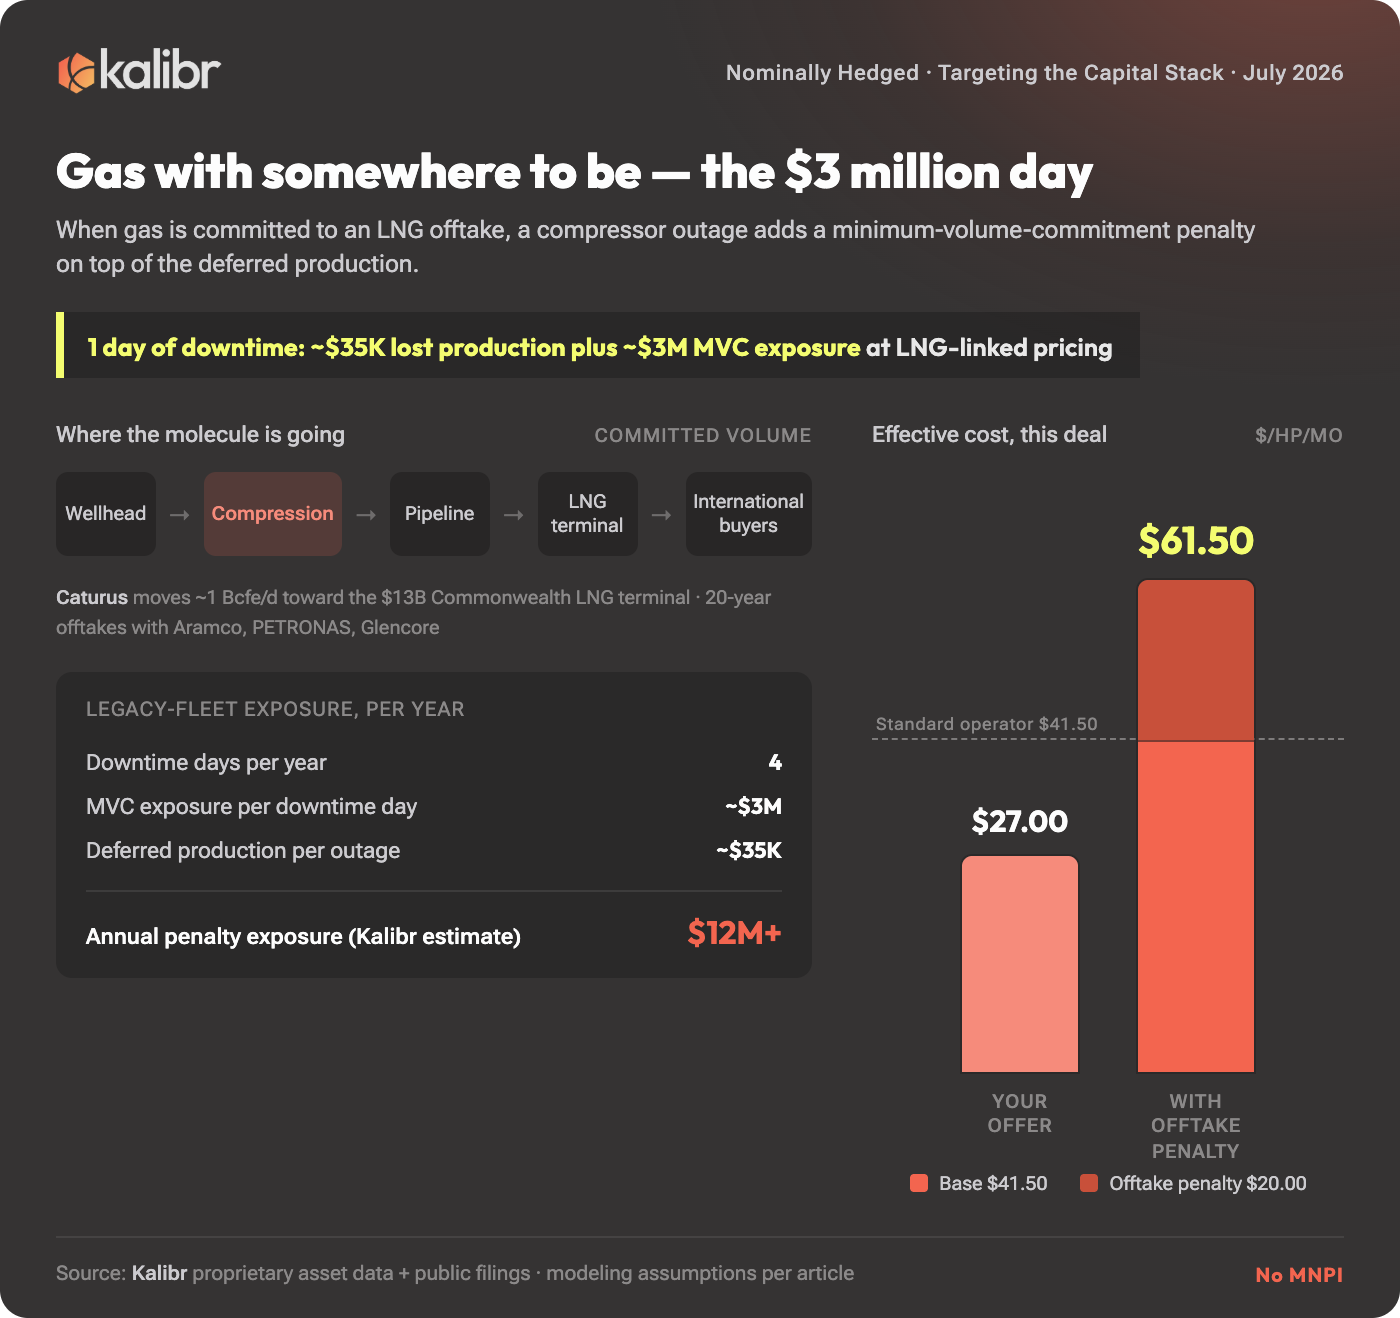
If your differentiation is uptime, this shape is where it reprices most violently. The difference between 97% and 99% runtime is a rounding error on a production report and an insurance policy priced in millions on an offtake contract. And the shape is growing: every LNG FID, every firm-transport commitment, every datacenter power deal with volume obligations mints another operator whose gas has somewhere to be.
Line the four up and the targeting logic prices itself. Standard operator, $41.50 effective. Recycle-ratio drag, $53.50. Post-merger, $56.50. LNG-committed, $61.50. Securitized, $66.50. All of them against the same $27.00-class offer, and in every case the fifth layer, the part that varies, is invisible on the compression invoice and legible in public filings. The shape also hands you the opening line: coverage ratio, synergy ledger, peer screen, penalty exposure.
Fifteen Dimensions on a Napkin
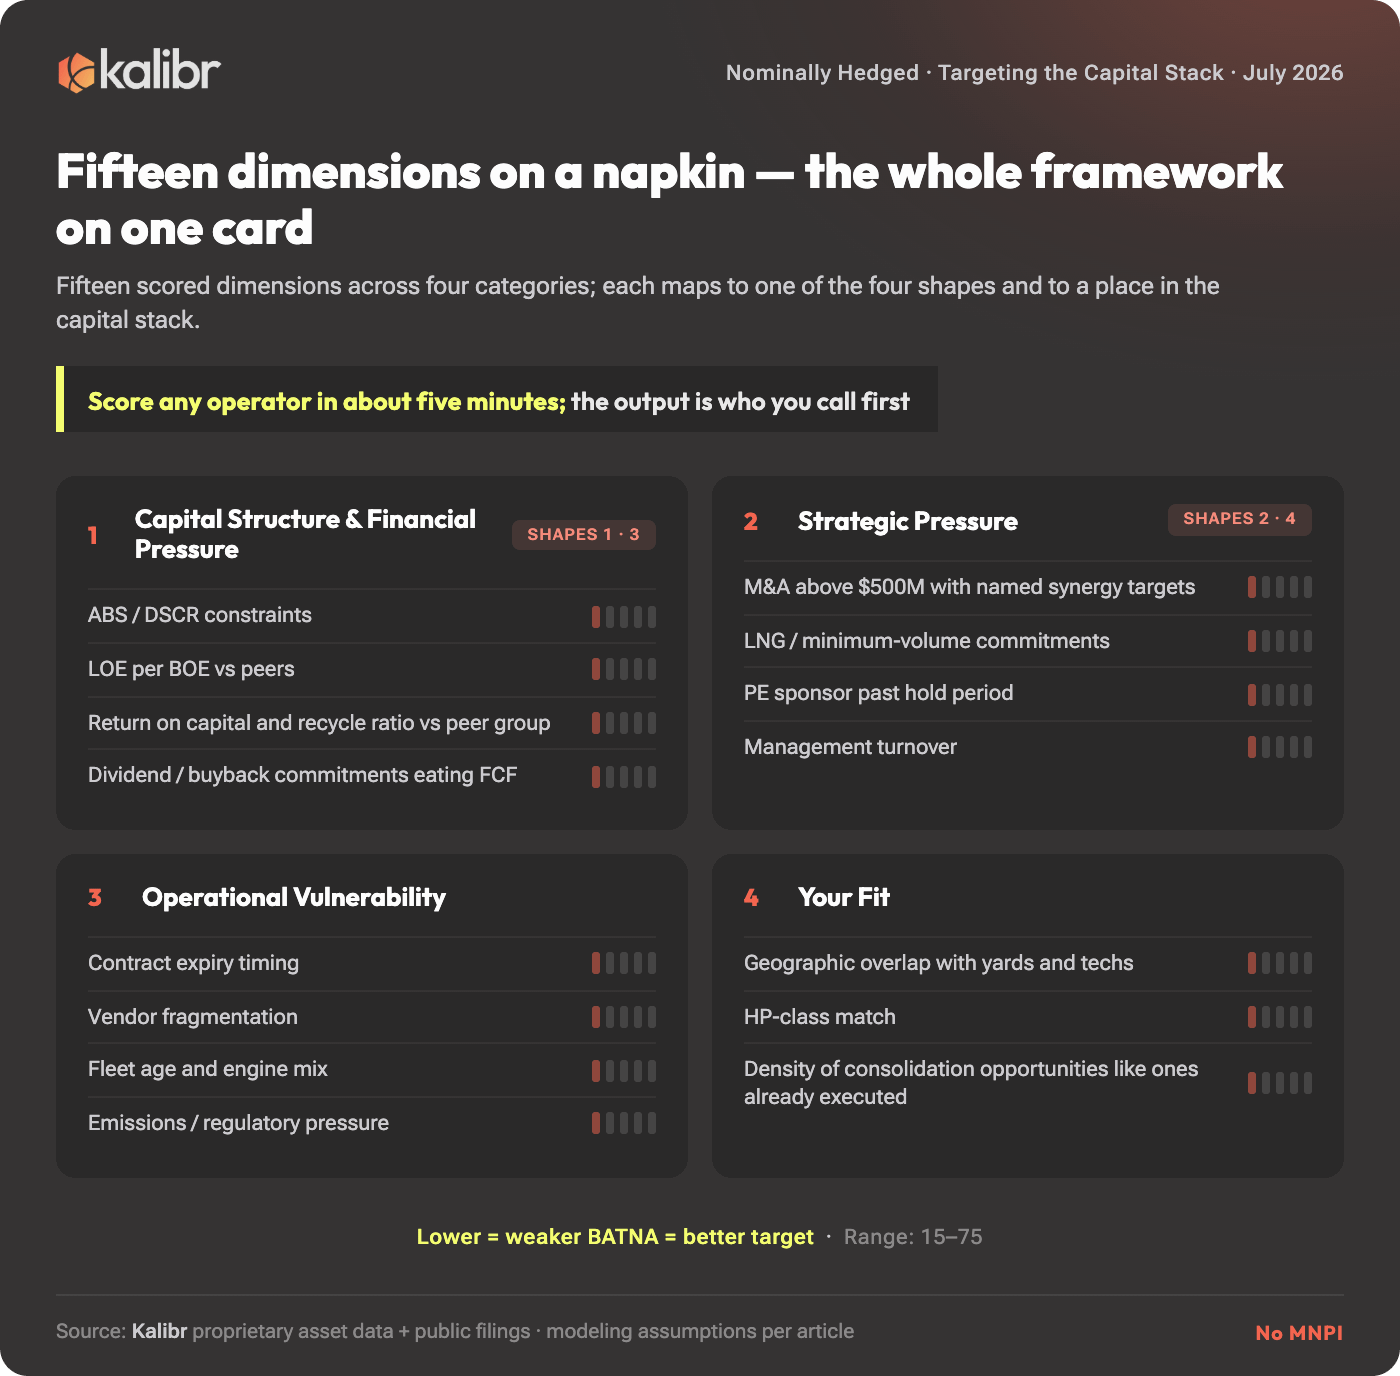
The four shapes are the extreme cases, and real operators are blends. An ABS sponsor that just closed an acquisition is shape one wearing shape two’s schedule. A gassy operator with above-peer LOE and a new firm-transport commitment is three and four at once. So the scoring system generalizes the shapes into a scale you can run on any operator.
Fifteen dimensions, four categories, each scored, where lower means a weaker BATNA and a better target. Capital Structure and Financial Pressure: ABS and DSCR constraints, LOE per BOE against peers, return on capital and recycle ratio versus the peer group, dividend and buyback commitments eating free cash flow (shapes one and three live here). Strategic Pressure: recent M&A above $500 million with named synergy targets, LNG or minimum-volume commitments where downtime is contract breach, a private equity sponsor past its hold period, management turnover (shapes two and four live here). Operational Vulnerability: contract expiry timing, vendor fragmentation, fleet age and engine mix, emissions and regulatory pressure. And Your Fit: geographic overlap with your yards and techs, HP-class match to your fleet, the density of consolidation opportunities shaped like ones you have already executed. Total range, 15 to 75. Scoring takes about five minutes per operator; you can do it on a napkin before a call. The goal is a relative ranking, an answer to the only allocation question that matters on a Monday morning: which operator do I call first?
Eight Operators, Scored
We ran it on a real peer set of eight operators, a mix of public, private equity-backed, supermajor-affiliated, and ABS-backed names. Anonymized (a scored board with the names on it is the sort of thing we build for clients), the composite came out: Operator A, 35. Operator B, 37. Operator C, 40. Operator D, 40. Operator E, 46. Operator F, 47. Operator G, 52. Operator H, 53.
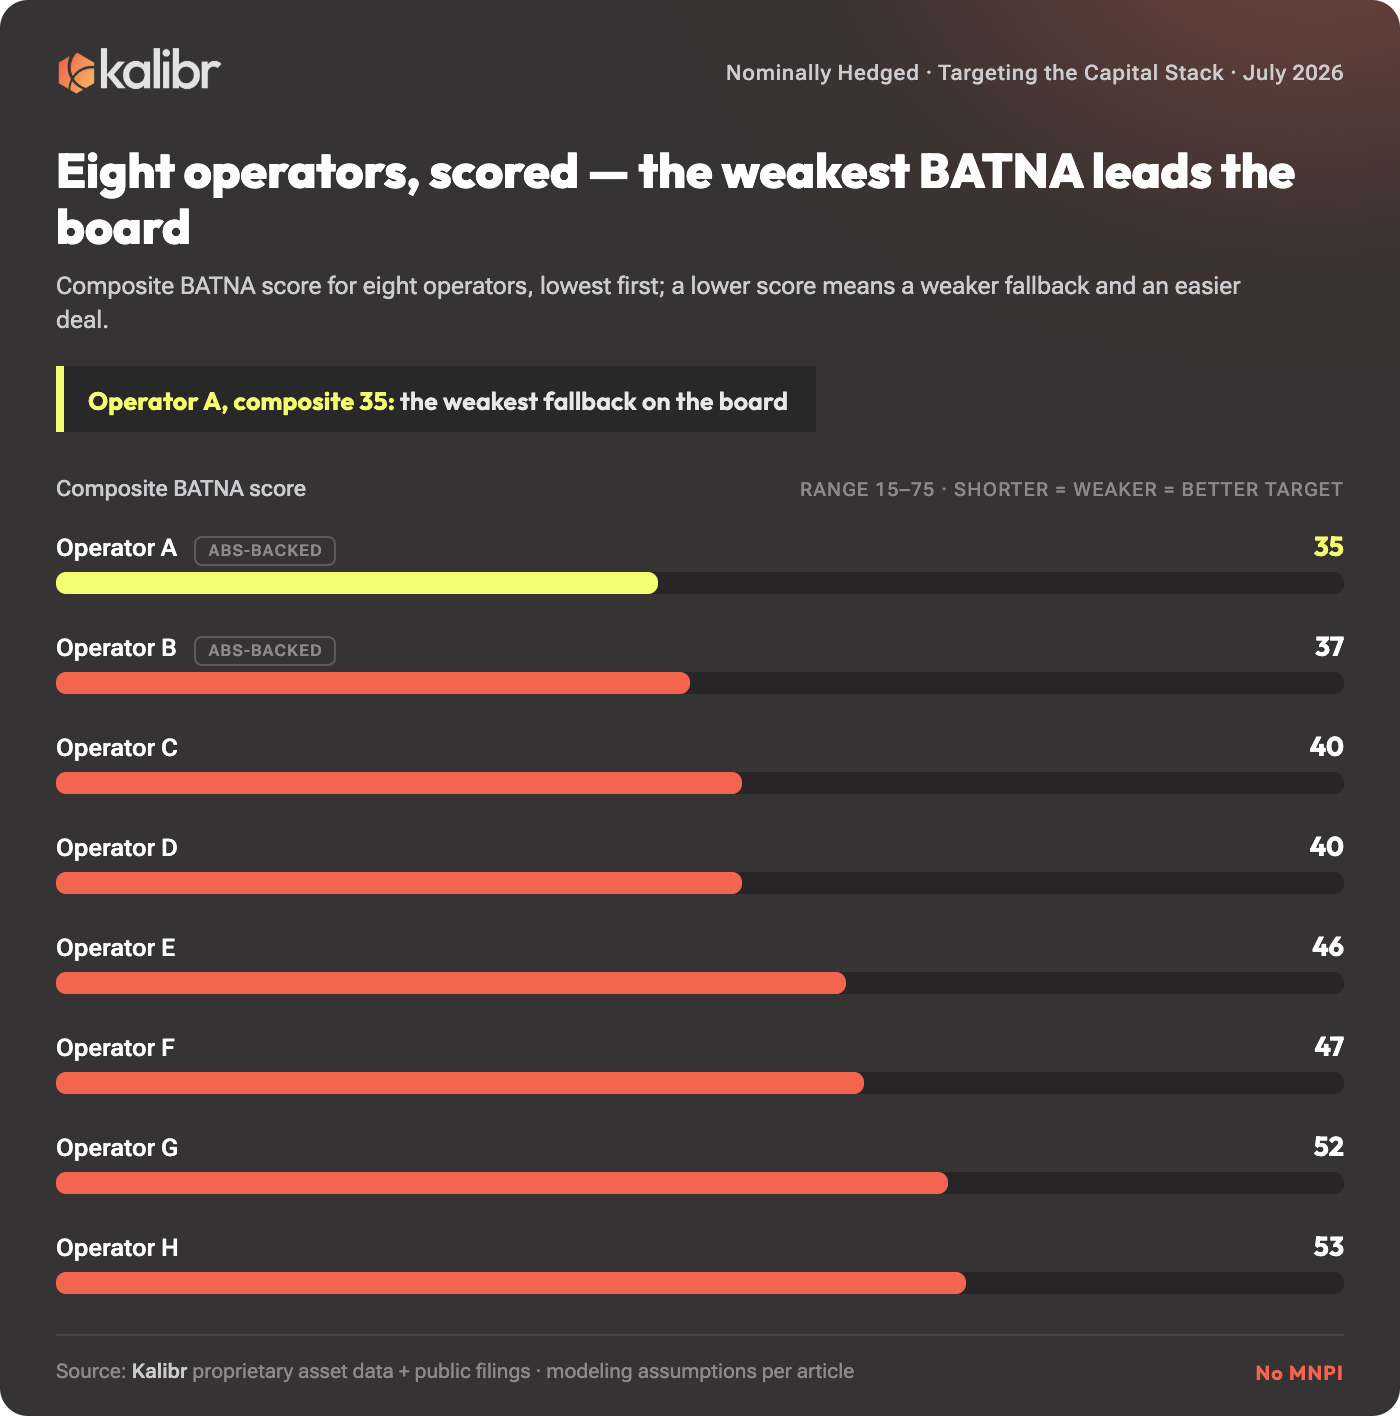
Two of the eight are ABS-backed. They are A and B. One slightly deflating way to read that is that we built a fifteen-dimension scoring system and it told us to go call the two operators whose bond documents already require them to care, which, fine, you could have guessed from the couch. The more informative reading is that nobody put a thumb on the scale: shape one loads on just a few of the fifteen dimensions, and the two securitized names still sorted themselves to the top of the board, the framework arriving at its own thesis from the other direction. (Operator B, for the record, carries a trailing DSCR of 1.13x against a 1.25x threshold, which turns the sweep arithmetic from shape one into a description of their current quarter.)
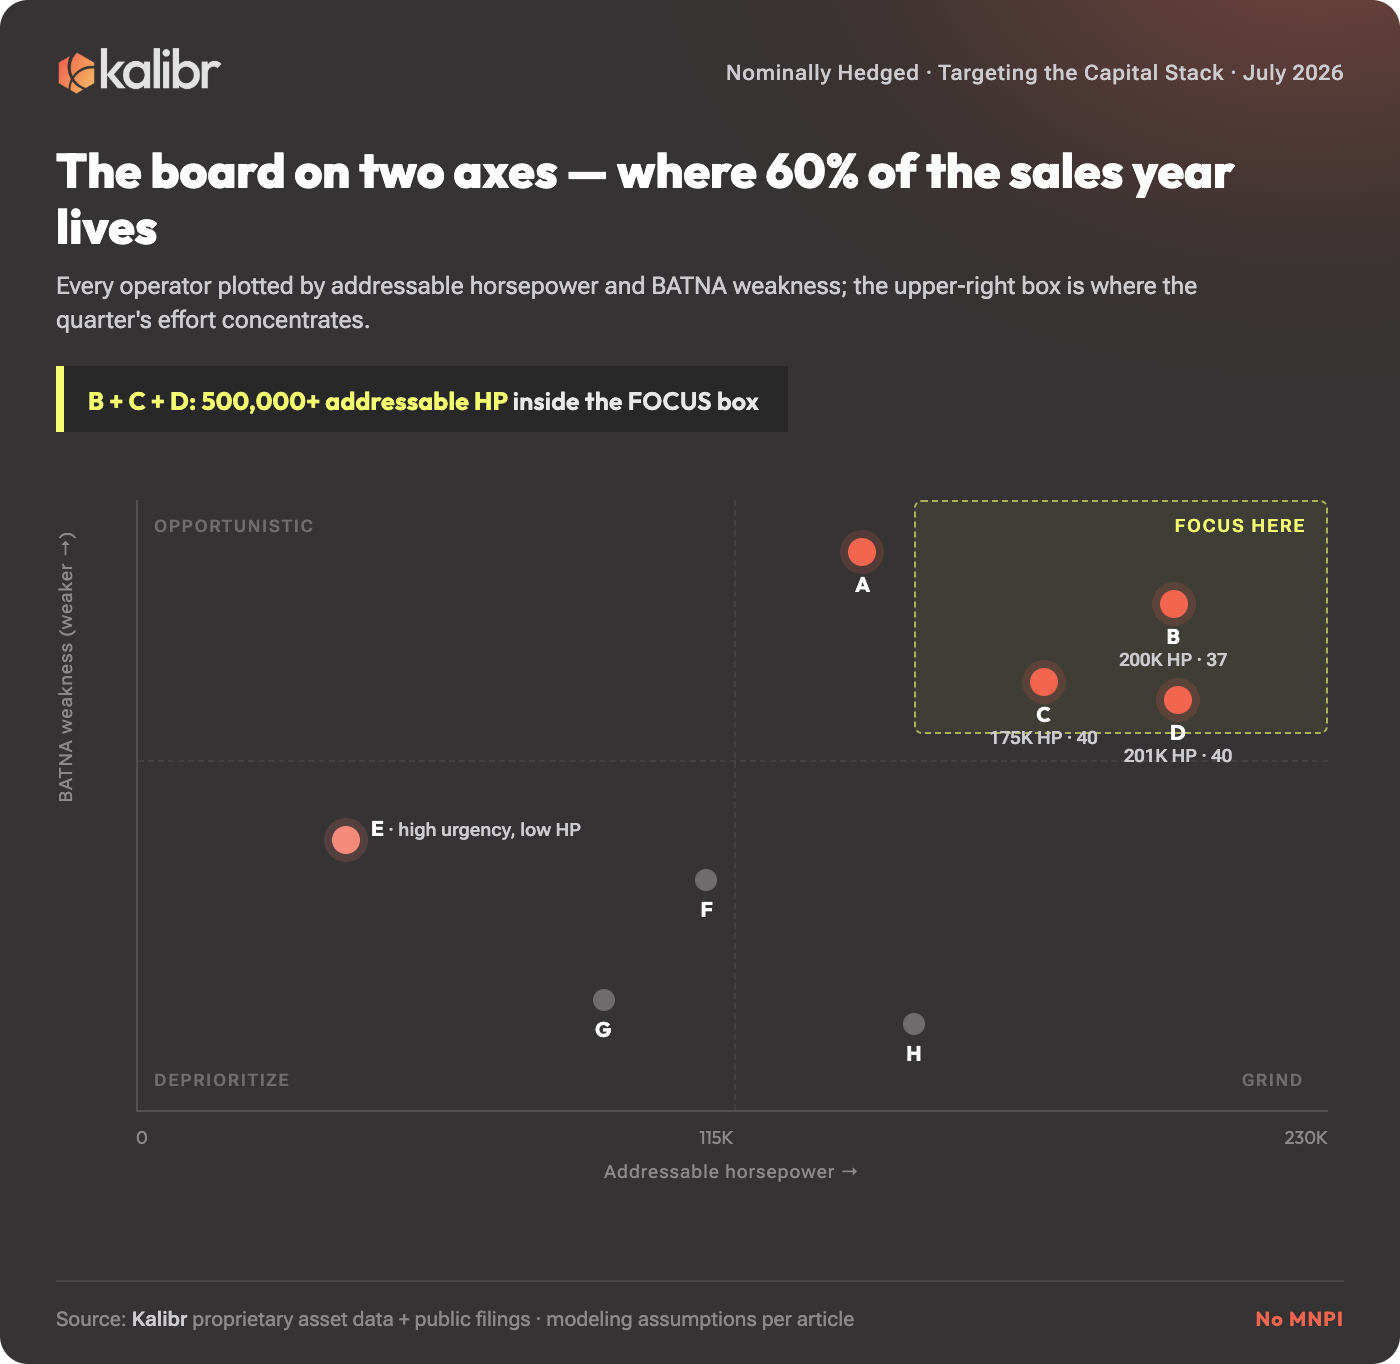
Then put the board on two axes, because a weak BATNA with no horsepower attached is a nice conversation and a bad quarter. Vertical, BATNA weakness. Horizontal, addressable horsepower for your fleet. The upper right is where the year lives. Operator B: around 200,000 addressable HP, score 37, integrating billions of dollars of acquisitions inside eighteen months with nobody yet assigned to rationalize the compression fleet. Operator C: around 175,000 HP, score 40, rebidding every service contract inside a nine-figure synergy program (shape two, mid-cascade). Operator D: around 201,000 HP, score 40, a supermajor’s shale subsidiary with a governance vacuum we will get to shortly. Something over half a million horsepower among the three of them, and that corner is where 60% of your sales time should go. Below the line you’re grinding against strong-BATNA accounts. To the left the deals are real, just too small to build a year on.
What the 10-K Cannot Tell You
A score tells you who. Which unit, in which quarter, against which incumbent, with which opening line: that takes a second layer of data, and none of it lives in a filing.
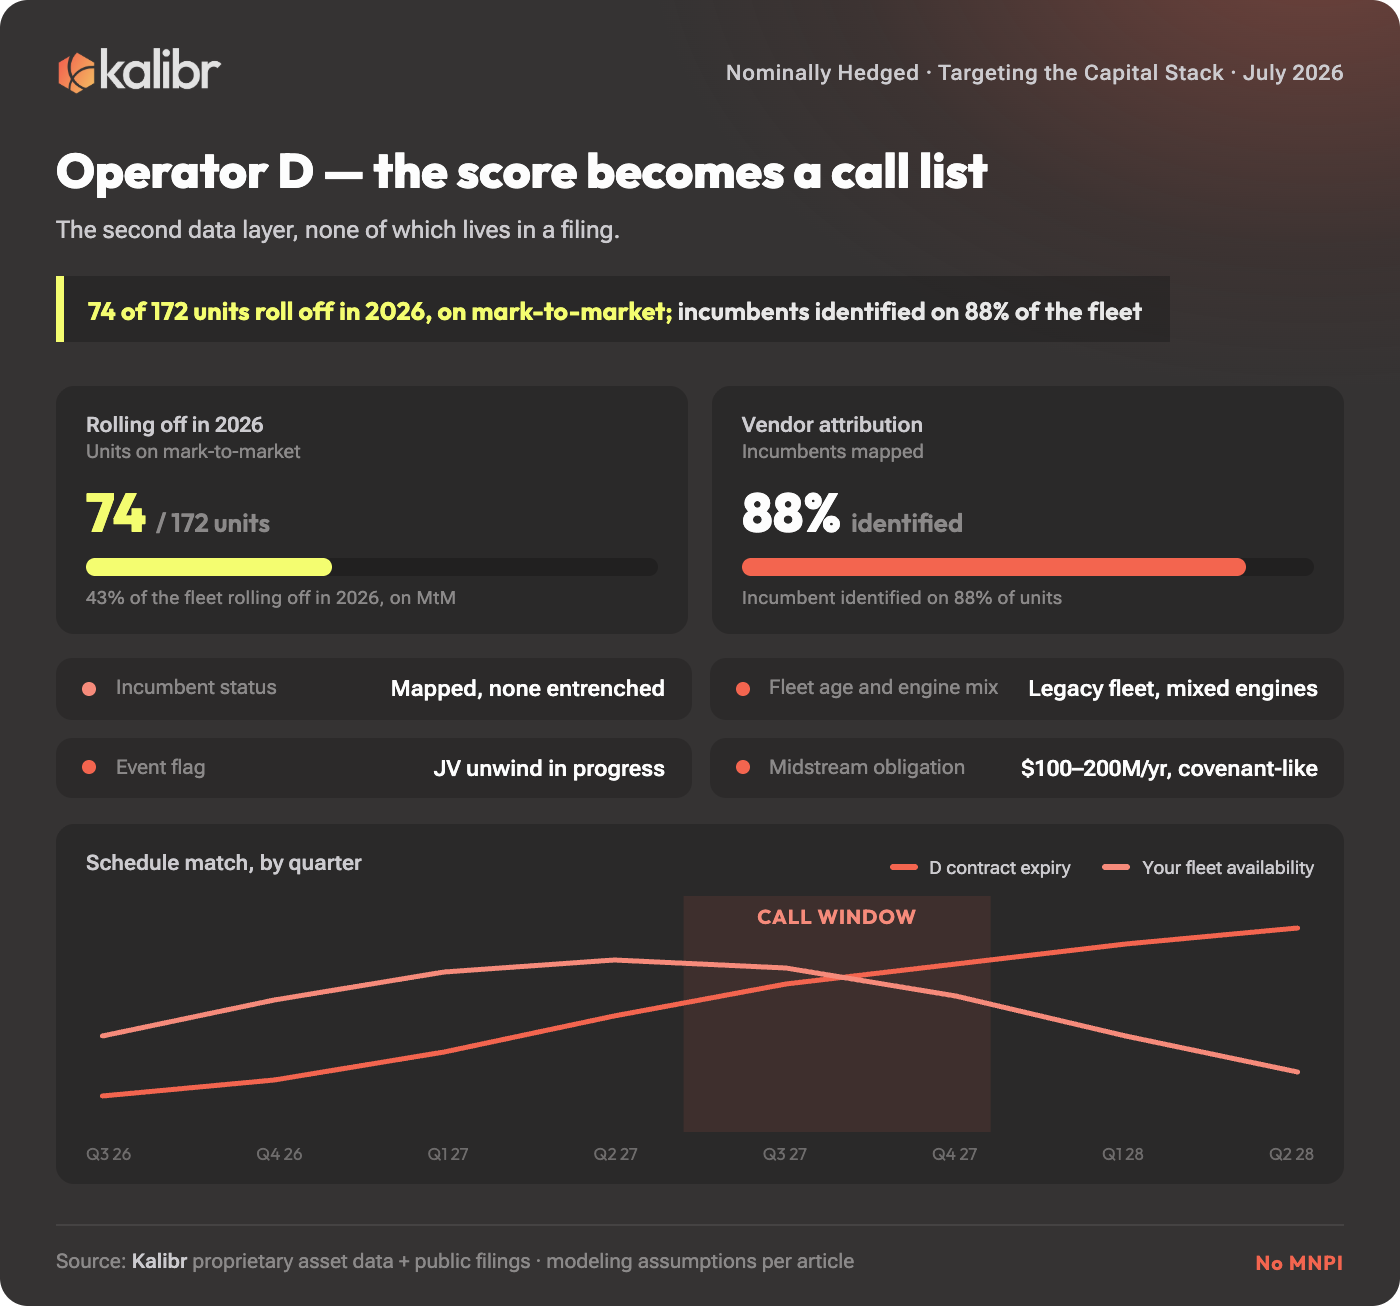
What is expiring, on their side. Month-to-month and near-expiry contracts are zero switching cost; a fleet where a third of the book rolls inside a year is a different account than the same fleet locked up for four. Operator D again: of 172 units, 74 are already past primary term.
What is freeing up, on yours. This is the layer vendors forget they own. Your fleet has a schedule too (units coming off term, redeployments, new builds arriving from the packager), so parse it into horsepower available to set, by quarter, and lay that availability curve against each account’s expiry curve, because targeting is matching the two schedules in time. A weak-BATNA account whose contracts roll in the same two quarters your big iron frees up is a different priority altogether than the identical account eighteen months out of phase. With new-build lead times still quoted in years rather than months, iron in hand at the right moment is the scarcest thing you sell, and the schedule that tells you when you will have it is a strategy document.
How old their iron is and what is bolted to it. A 10-to-13-year legacy fleet runs 85% to 90% uptime, which is 37 to 55 days of downtime a year, against 95% to 99% on modern equipment. Older fleets carry the biggest hidden-cost layer in the baseline stack. And mixed manufacturers on one pad, a Cat next to a Waukesha next to an Ajax, are a consolidation argument with a dollar figure attached, not a piece of trivia.
Who holds it. The incumbent’s name is most of the negotiation. Market-standard rental contracts in this space guarantee 95% to 98% uptime, with termination rights that trigger only after roughly three consecutive months of failure; mobilization and demobilization pass through to the customer, commonly $100,000 to $200,000 a unit; and mid-contract facility reconfiguration is the customer’s problem. Those are the gaps a newer fleet can put on paper and an incumbent structurally cannot match: a 99% guarantee with immediate hourly credits, transition-cost absorption, reconfiguration amortized over the term. Know which incumbent you are walking in against and which of these gaps their paper leaves open.
What just happened in the news, because operators change shapes overnight. Caturus was a conventional account until Commonwealth reached FID; one press release later it was shape four, and every uptime slide in every vendor deck aimed at it repriced. The mechanism repeats with a different variable elsewhere: when Chevron does a deal that puts a hard price on fuel gas, every Mcf a compression fleet burns becomes a number somebody owns, and the vendor with the most fuel-efficient iron in the basin has a value case that did not exist the week before. A scored board without an event feed is a snapshot, and this market happens in motion.
And who owns the compression book at all. More than five vendors with no unified procurement desk is a governance vacuum, and Operator D is the canonical case, which is why it keeps appearing in this piece. Roughly 201,000 HP across 172 units. And after the dissolution of the joint venture that used to manage the assets and a fixed midstream obligation on the order of $100 to $200 million a year to an outside capital partner functions like a covenant even though it is not one. The score put Operator D on the shortlist. The overlay is what turns the row into a call: lead with the expired units, and walk in knowing there is no entrenched incumbent to displace, because nobody currently owns the book you’re proposing to run.
Monday Morning
So the board is ranked and the overlay is loaded, and what a compression company does with it is mercifully concrete.
Allocate the scarce things to the upper right. Your scarce resources are two or three great closers and a finite budget of pricing flexibility, and both belong in the FOCUS quadrant. Your best engineer-turned-closer has no business grinding an Operator H shaped account, score 53, maybe 15,000 addressable horsepower, while Operator C sits right there.
Open in the shape’s language, because the first number out of your mouth changes by shape. For the securitized operator it’s the coverage ratio: every dollar of operating cost you take out expands residual equity through the sweep, and the rate sheet can come out after the $66.50 is on the table. For the post-merger operator it’s the synergy ledger; for the recycle laggard, the peer screen the CFO already dreads; for the committed operator, the price of a day of downtime. Same iron, four different first slides.
Practice concession discipline. Protect the monthly rate, the uptime guarantee tier, and term. Give, in this order, redeployment flexibility, fuel arrangement details, and MOB and DEMOB timing. And never concede a single issue in isolation: if they want the rate down, the question is which uptime tier they are willing to accept. Every concession trades inside the package.
And on the programmatic acquirers, negotiate the compounding clause: a first right of refusal on compression for the next package they buy. The factory model is committed to feeding its own pipeline, so that clause is an option on every future package, and it prices cheapest on the day you close the first deal.
I’ll also say the part I usually leave implicit, since this piece is already a manual. This is how we sell, too. Kalibr’s own outbound runs on exactly this machinery: a scored peer set, the fleet overlay, a message built around whichever event just repriced the account. I won’t dress the result up as a controlled experiment, but our hit rate on outreach is a large multiple of what it was before we aimed it this way, for the boring reason that the message arrives already knowing why this quarter, why this account, why this unit.
What Moves the Board Next Quarter
The board is not static, which is most of the reason it is worth maintaining. What I am watching:
Collateral mix. The ABS pool keeps tilting oil-weighted, which makes more Permian and Mid-Continent operators securitizable. Shape one is growing.
Warehouse capacity. If Citi follows Goldman into ABS warehousing, expect more factory-model sponsors, which means more programmatic, cost-obsessed acquirers to score.
The merger tape. Every announced deal with a public synergy number mints a shape-two account on a schedule, and every integration that stalls makes the remaining target more compression-dependent.
FIDs and firm commitments. Every LNG FID, MVC, and volume-committed power deal mints a shape-four account overnight. The press releases move faster than the filings here.
Expiry roll. Contracts roll every month; the overlay is a living document. Re-rank quarterly at minimum.
PE exit clocks. Sponsors past their hold period get urgent about EBITDA margins, which moves an operator up the board without a single molecule changing hands.
Governance vacuums. Every large consolidation or JV unwind risks minting another compression book that nobody owns. The next Operator D is being assembled in a data room somewhere right now.
Anyway. I opened on a soapbox about data, so I should be honest about what this piece actually did. It started from a decision (which account gets my best people this quarter) and the principles underneath it (relativity, opportunity cost, the arithmetic of a cash sweep, the price of a public promise), and only then went looking for data, most of which turned out to already exist in public. It is the same market and the same filings; the difference between trivia facts and a call list was the order of operations. And I should be honest about what a framework buys, which is exactly one thing: a defensible answer to where your two or three great closers spend the quarter. The deal itself it leaves to you, and if everything in a sales organization is relative, that answer is still most of what strategy means at this altitude.
The paradox at the center still strikes me as the satisfying part: the operator with the weakest alternative is the one who transacts, and a capital stack is where weakness becomes legible, the ABS waterfall being just the most literal version anyone has committed to a term sheet. Nobody selling compression built any of these constraints. A covenant did, or a synergy slide, or an offtake contract with Aramco’s name on it; your entire contribution is having read the documents. Somebody at every one of these operators is always counting something, and whether the line item they’re counting on is yours comes down, I think, to who shows up having done this math.
Where this goes next: starting in August, the paid tier gets a monthly targeting board built on exactly this framework, one per basin, re-scored as the filings and the expiry tape move. That is the standing product, and it arrives with your subscription.
The customized version is a different animal: this machinery mapped to your differentiation and your strategy (your fleet, your yards, your peer set, the scored board with the names on it), and the right first step there is a message and a 30-minute working session, not a PDF.