

Nominally Hedged - November 12th, 2025: Pretty, Pretty, Pretty Good Economics
Why chemical spend is the most psychologically difficult and strategically under-optimized cost center in oil and gas.

I grew up a Seinfeld kid, which eventually turned into a full-blown Curb Your Enthusiasm habit. My pre-bed ritual is a rotation of Larry David episodes, and last week it was The Safe House. The plot: Larry signs up for an unlimited car wash plan, then becomes obsessed with getting his money’s worth. He times washes around weather forecasts, avoids dust, and turns a simple convenience into a cost-benefit cage match.
It’s peak Larry David: wasting more energy avoiding waste than the waste itself was ever worth.
Which, incidentally, is how most operators treat chemical spend.
Ask any production or operations engineer. Chemicals are the most resented line on the LOE. They’re invisible when they work, loud when they don’t, and somehow always the first target when management needs to trim costs. Every month there’s that one cell in the spreadsheet flashing cut me. The better your chemicals perform, the less evidence you have they were ever necessary. Economists call it a counterfactual. Engineers call it Quarterly Board Meeting prep.
At Kalibr, this is one of the most common categories we get asked to untangle. The issue isn’t that chemicals are unnecessary. It’s that no one can prove the current cost structure is rational. So, let’s walk through a simple framework to fix that.
Five Steps to Rational Chemical Spend
Feedstock Decomposition and Cost Modeling – Break every chemical into its component inputs, map each to transparent price indices, and identify where cross-industry demand drives cost volatility.
Supplier and Inventory Dynamics – Quantify pricing power by looking at balance sheets, inventories, and short-cycle demand.
Should-Cost Benchmarking – Combine the inputs into a baseline model and measure immediate savings potential.
Forward-Looking Monitoring – Build a living system that tracks feedstocks, freight, and demand signals with automated triggers.
Direct Sourcing – Eventually, stop paying other people to buy your chemicals for you.
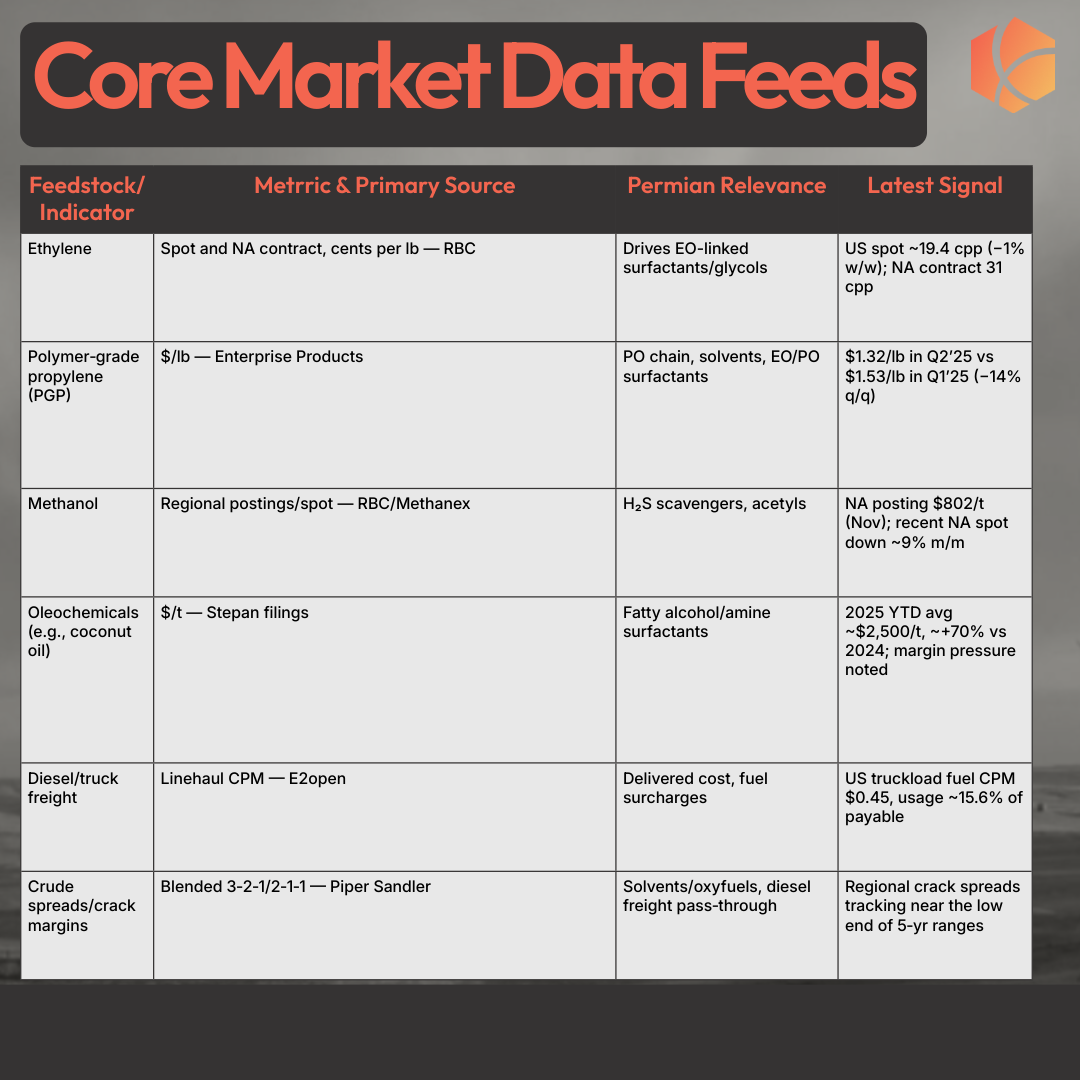
Let’s ground this in the Permian Basin.
1. Feedstock Decomposition and Cost Modeling
Engineers like process, so we’ll start there. The goal is to break each chemical into its core molecular precursors, link those to public indices, and understand which ones are domestic, which are imported, and who else in the economy needs them.
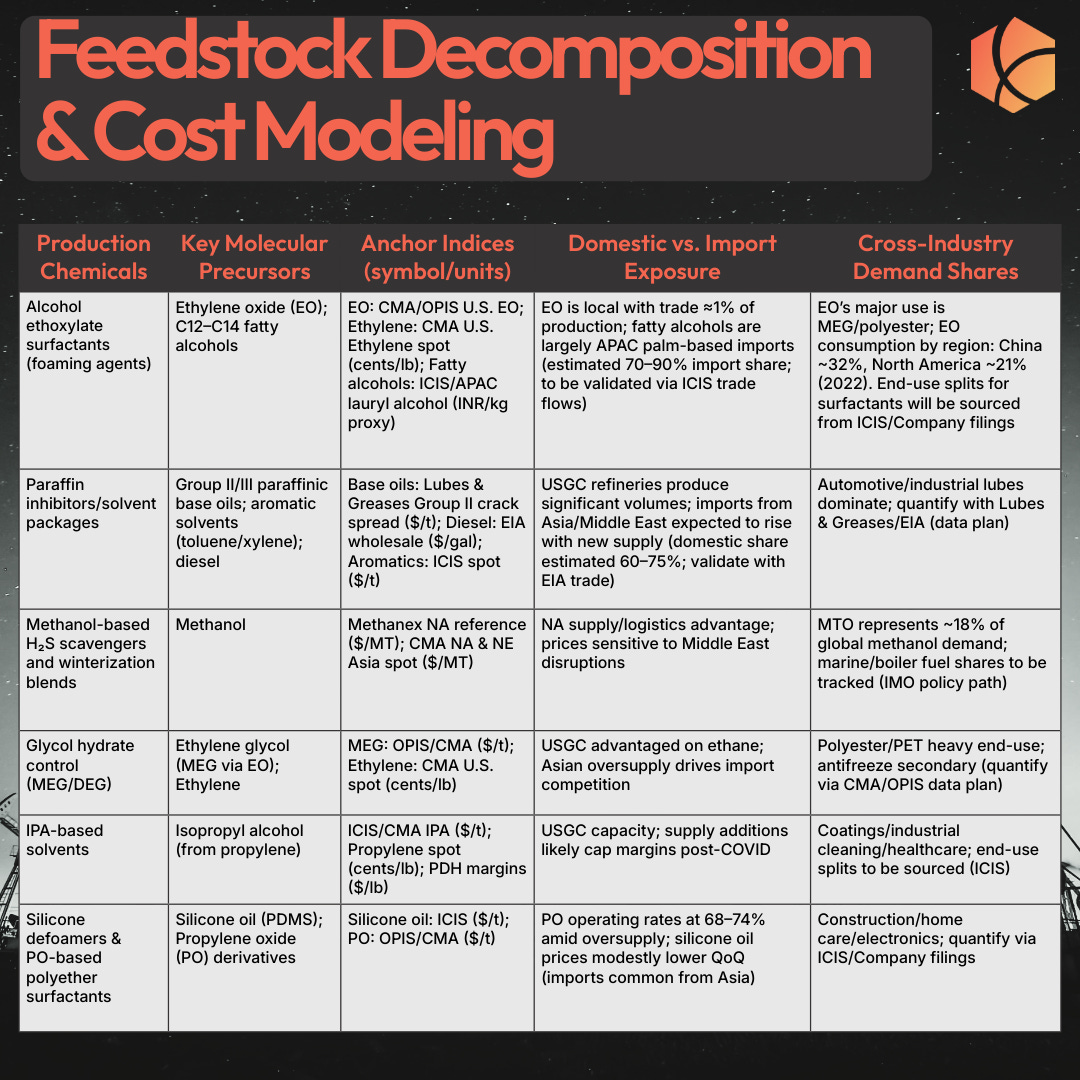
Take foaming agents. These are typically alcohol ethoxylate surfactants made from ethylene oxide (EO) and C12–C14 fatty alcohols.
EO is traded locally, with only about one percent imported, benchmarked through CMA or OPIS.
Fatty alcohols are mostly palm-based imports from Asia, roughly 70 to 90 percent of total supply.
EO demand comes mainly from polyester and MEG production, not oil and gas, which matters when China’s textile plants sneeze and your chemical supplier catches a cold.
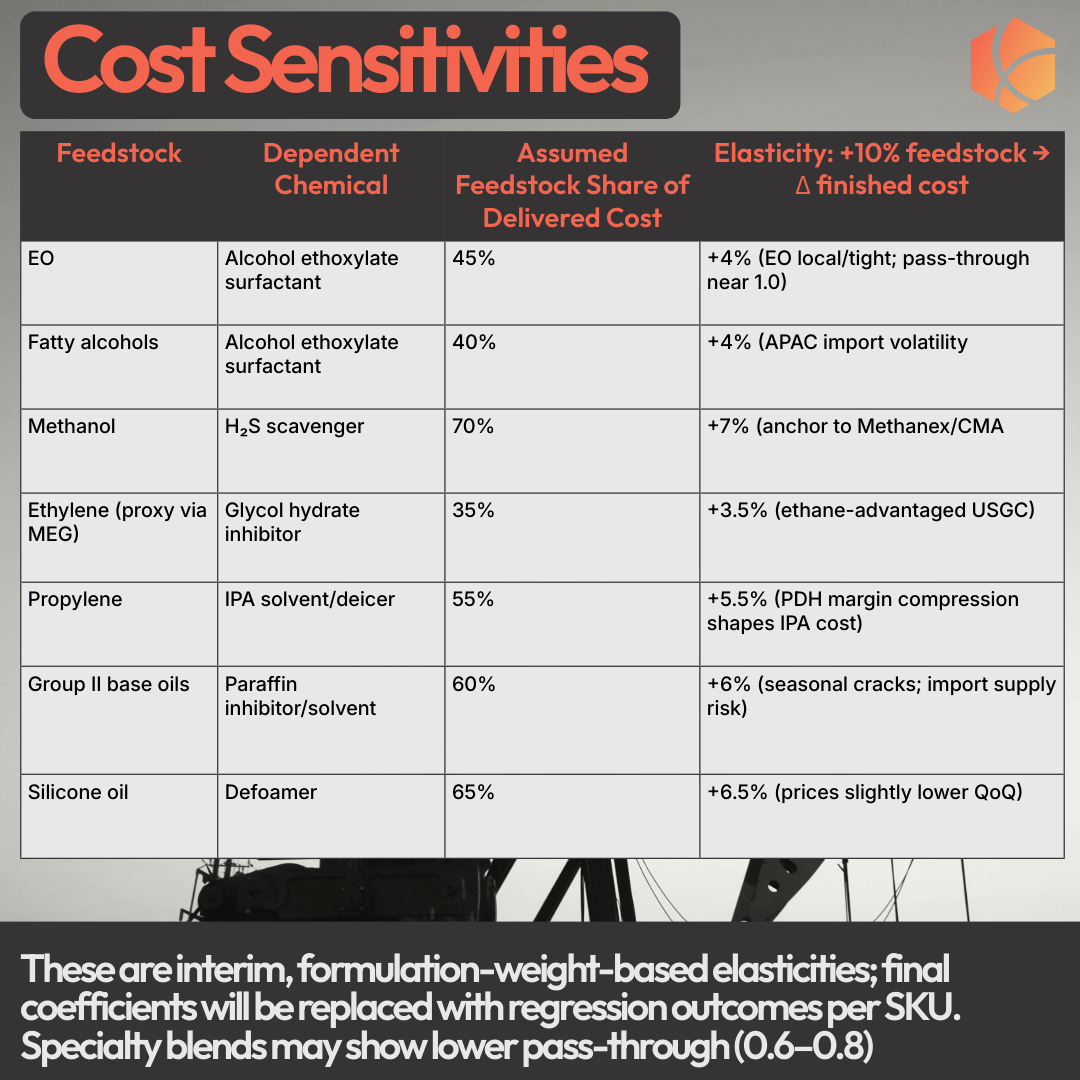
Once the components are mapped, we regress the end-product price against its feedstock indices using two to three years of historical data. Add freight, packaging, and a normalized margin, and you’ve built a defensible should-cost curve in dollars per gallon.
The result is a feedstock-to-finished cost curve. It shows exactly how index movements flow through to delivered cost. Alcohol ethoxylate prices, for example, move with EO outages on the Gulf Coast and palm-based alcohol volatility in Asia.
The point isn’t precision for its own sake. It’s to turn “the chemical budget looks high” into “ethylene oxide moved up six cents a pound and your supplier passed through seven.”
2. Supplier and Inventory Dynamics
The Kalibr approach borrows from game theory. We model supplier leverage across multiple dimensions: customer exposure, basin demand, inventory strain, credit posture, and cross-industry pull. But for simplicity, let’s focus on one that’s easy to visualize — inventory.
Inventory isn’t free. It carries a financing cost that erodes supplier margins and reveals who’s most motivated to move product. Knowing that cost helps you quantify where the real leverage sits.
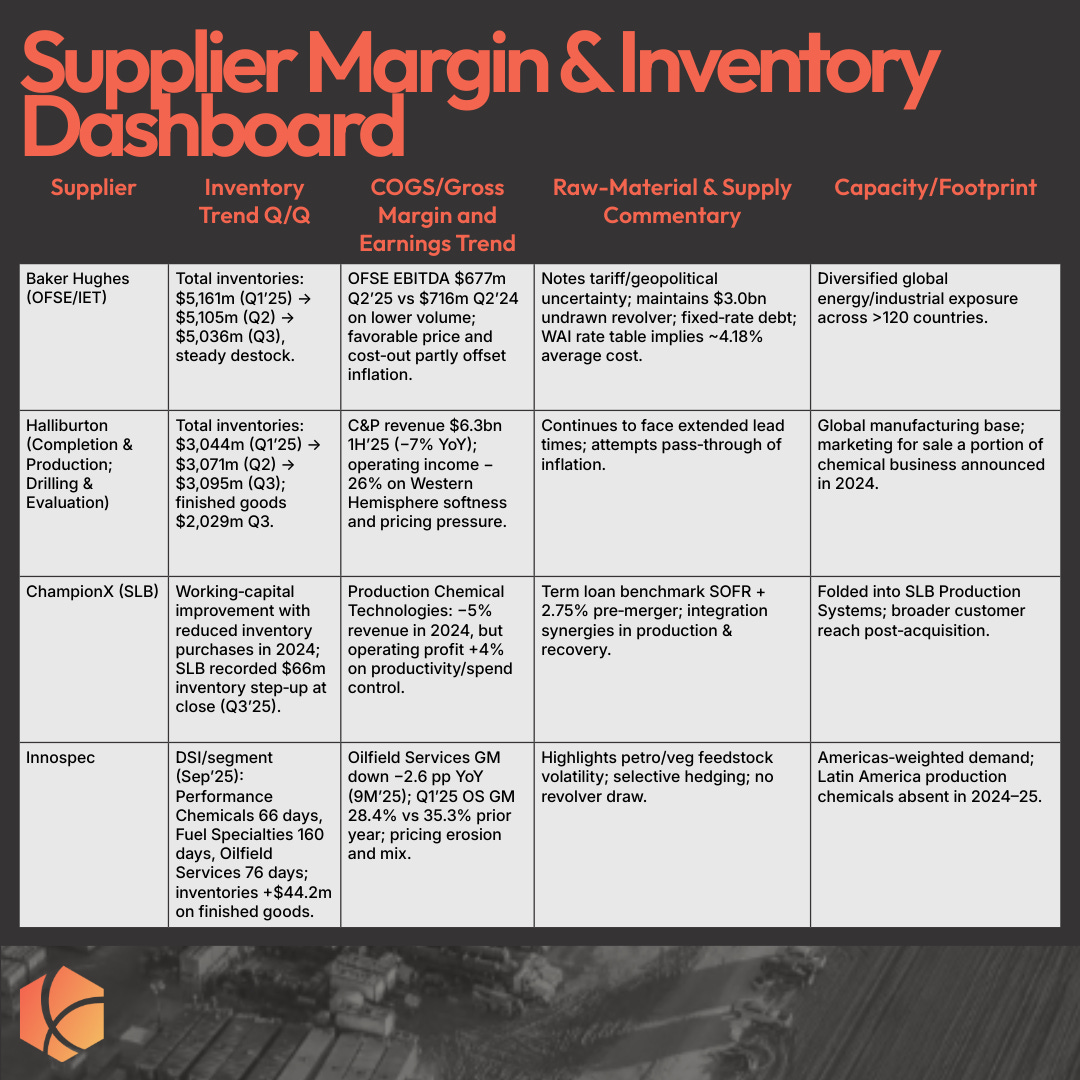
Illustrative inventory carrying costs:
Baker Hughes: $5.036bn × ~4.18% ≈ $210m annual (~$52m/qtr). Lower inventories reduce carry and support negotiation flexibility.
Halliburton: $3.095bn; with investment‑grade profile and fixed debt, apply illustrative 4–5% → $124–155m annual (assumption)
ChampionX (Pre-SLB) — Debt cost benchmark SOFR+2.75%; post‑close funded within SLB structure.
Innospec: No revolver usage; financing carry de‑minimis; focus on DSI mix effects
Once quantified, the BATNA range becomes visible. Anything above the supplier’s BATNA and they have better options. Anything below yours and you do. That turns “we think the price is high” into a concrete, data-backed leverage map.
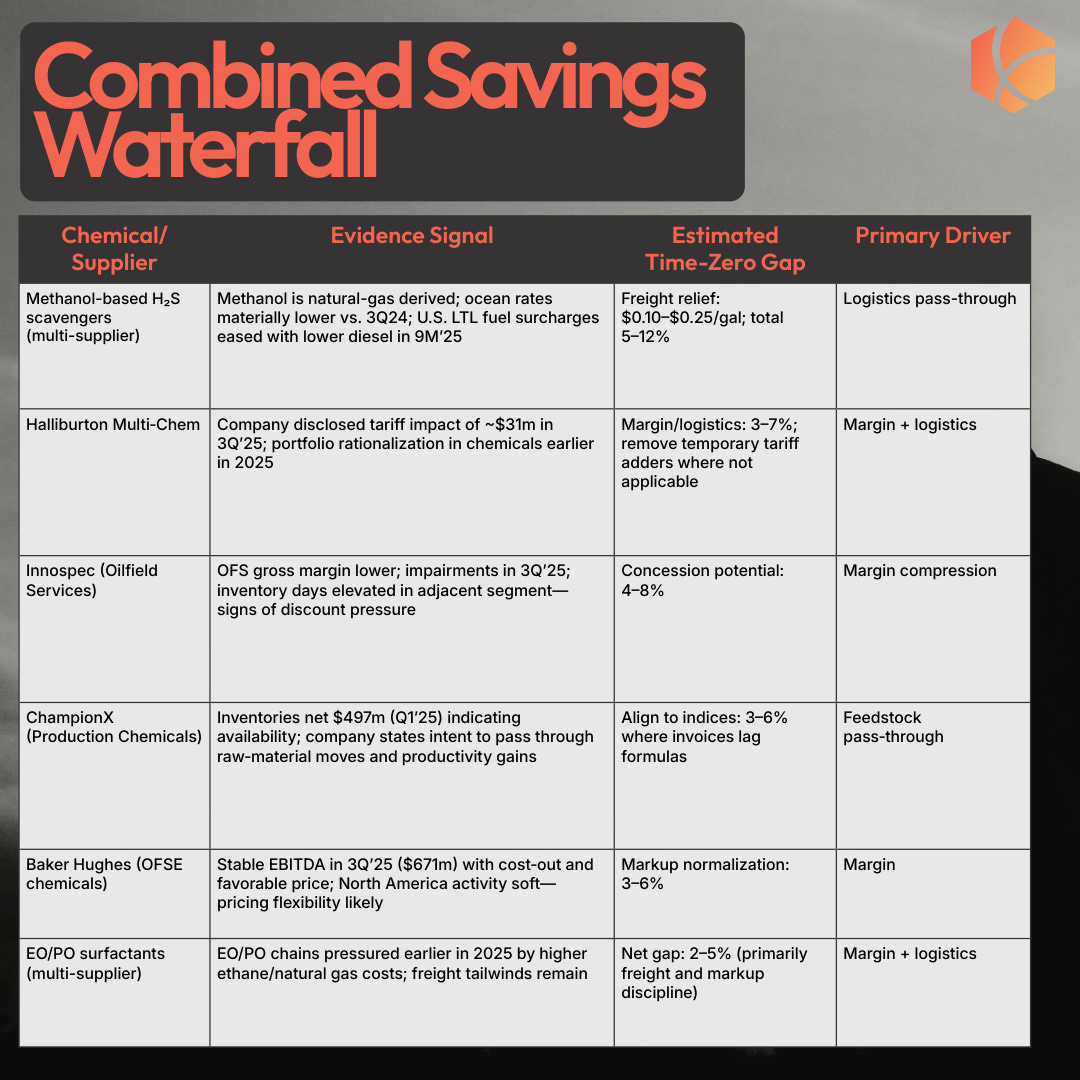
3. Should-Cost Benchmarking and Savings
Now we combine the models. Feedstocks define the floor. BATNA defines the ceiling. Somewhere in between lies the right price.
Example:
A methanol-based H₂S scavenger is roughly 60 percent methanol by cost. A 10 percent decline in methanol prices should cut delivered cost by about six percent. Adjust freight from $0.18 to $0.10 a gallon and you’ve got another few cents of margin.
EO/PO surfactant blends can shed 4 to 6 percent through freight normalization and modest markup compression.
Across a typical portfolio, that’s a 3 to 8 percent savings window at time zero, with freight-heavy categories reaching double digits. On a $25 million chemical budget, that’s three quarters of a million to three million dollars a year of cash margin.
4. Forward-Looking Cost and Demand Monitoring
Optimizing once is clever. Doing it continuously is strategy.
We track market data—feedstock indices, manufacturing PMIs, freight rates, and supplier commentary—to flag when conditions justify a renegotiation.
Sample triggers:
Methanol index drops 15 percent in 30 days: open new RFPs for scavengers.
PGP down 10 percent quarter-on-quarter: reset escalation clauses.
Then we layer on a dashboard for visibility:
Current invoice versus should-cost
30-, 60-, and 90-day feedstock deltas
Freight indices from Houston to Midland and Odessa
Supplier exposure and alert status
Finally, we forecast the next quarter using a simple model with external variables like ethylene, methanol, freight, PMIs, and energy curves. The point isn’t to predict the future; it’s to know when the present is out of line with it.
5. Direct Sourcing
Eventually, you stop optimizing the middleman and start eliminating him.
That’s a long-term move, like insourcing compression or owning your own slickline trucks. But it’s also where structural margin lives. Operators with visibility into Gulf Coast producers—Dow, BASF, LyondellBasell, INEOS, Sasol, Shell—and regional blenders like Seatex or Monument can realistically capture mid-teens margins that currently accrue to service companies.
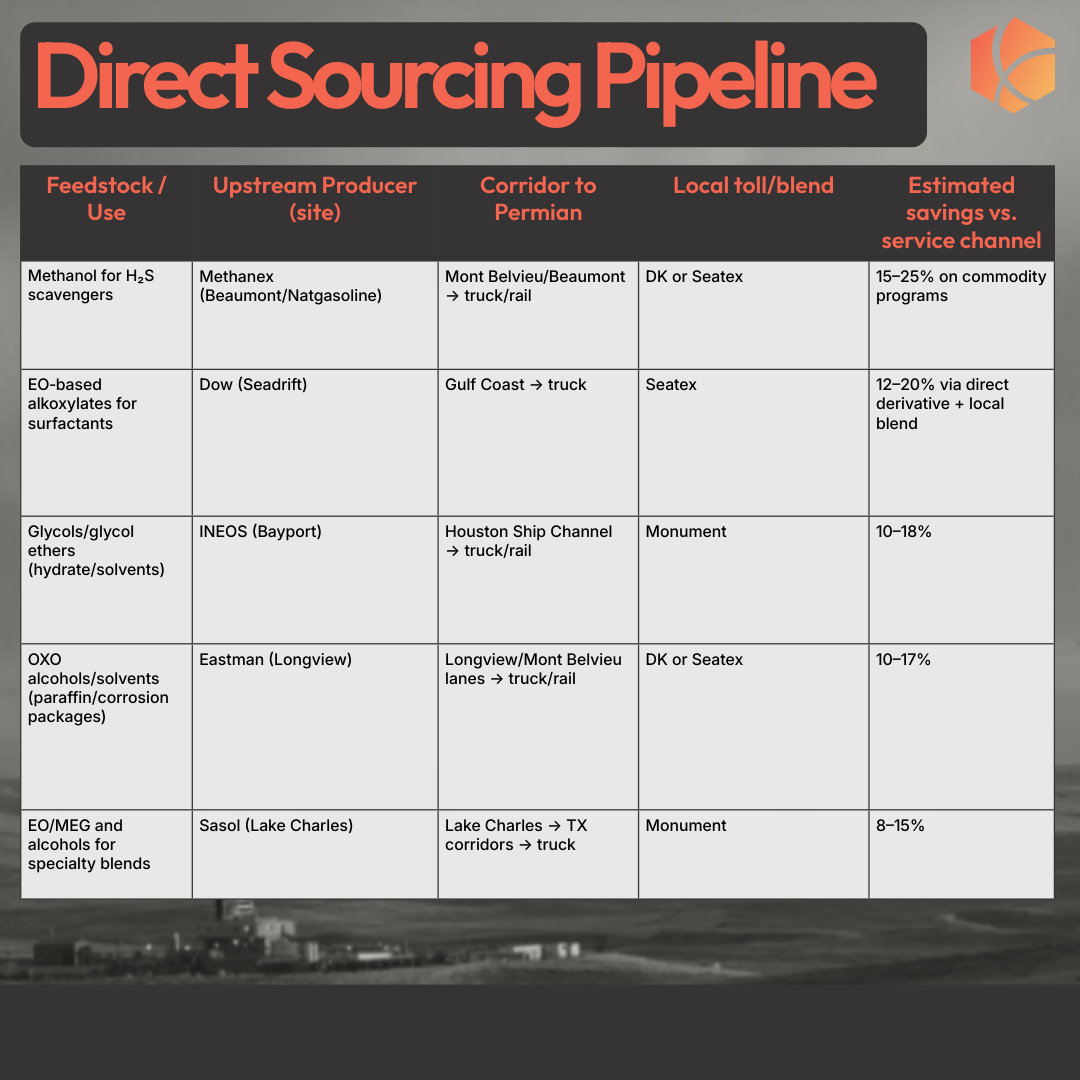
The savings from the first four steps usually fund the capability to make this happen. At that point, you’re not just cutting cost. You’re changing where in the value chain it accrues.
Conclusion
No one has a tougher job in Oil and Gas than Production Engineers. Spread thin, tasked with ensuring the basic cash flow of the business and constantly answering questions about their cost structure while being required to show proof no one can concretely show. IMO, this job gets even more critical as we move forward as an industry, with much of the focused around cost reduction being squarely on the D&C side or the easy G&A numbers of mergers. But, as we continue to face significant Tier 1 acreage headwind, it becomes more critical.
At a minimum, the workflow above ensures a justifiable cost structure and the ability to quickly capture market wins in an already strained environment. And that alone, as stated by the infamous Larry David, would be “pretty, pretty, pretty good.”