

Nominally Hedged | Graded on a Curve
Every operator benchmarks LOE against peers who have no standard either. Kalibr repositioned to be the standard: should-cost models on a compression census nobody else has.

In 1980 the United States had 39 Class I railroads. North America runs on six big systems today, and two of the six are in front of the Surface Transportation Board right now asking to make it five. Nobody will ever assemble a competing transcontinental network; the rights-of-way were pieced together in the nineteenth century. Railroading is also the most capital-hungry business on the continent, north of 18 percent of revenue reinvested year after year, six times the average American manufacturer. If any industry should be valued on its iron and its acreage, it is this one.
In one January 2017 trading session, CSX added roughly $8 billion of market value, a 23.4 percent move, on a personnel item. Hunter Harrison, a 72-year-old career railroader, had quit Canadian Pacific, and a fund called Mantle Ridge was shopping him to CSX as chief executive. That is eight billion dollars, priced in an afternoon, for one man’s way of running trains.
The market had its reasons. Harrison ran one play, Precision Scheduled Railroading: run the network on a fixed schedule instead of waiting for full trains, run longer and fewer of them, park what’s left over, and grade the whole railroad on a single number, the operating ratio, operating expense over revenue. At Canadian Pacific that number went from 81 percent in 2011 to 58.6 percent in 2016, and Pershing Square, which had won the proxy fight that installed him, exited with a $2.6 billion profit. He ran the same physical railroad his predecessor had run, the same track into the same terminals. What he changed was what it cost. And the trade was legible in advance, because the operating ratio is computed the same way at every carrier on the continent: an activist could look at CP’s 81, look at the Canadian National he had run until 2009, and underwrite the distance.
I’ve been thinking about Harrison because American shale has now done both of the things railroading did first, and is arriving at what railroading figured out next.
The consolidation is the finished part. Three years of M&A moved the core of American shale onto a handful of balance sheets, and what the deals did not concentrate, the drill bit depleted. Novi Labs, the Austin research shop that grades rock quality with machine learning, put a scoreboard on the consequences in April: sort last year’s E&P share performance by trailing recycle ratio, operating cash flow per barrel produced over the cost of replacing that barrel through the drill bit, and the quartiles land in order, best rock on top. (Every quartile was down in 2025; the ratio sorted the damage.) The three producers that were acquired out of existence last year all sat in the bottom quartile. Novi’s subject is the rock, and on that subject they are right. My interest starts where their report stops, because the rock is now spoken for: buy a competitor today and you’re mostly buying duration and overhead synergies, and from a 200 percent recycle-ratio base there is very little left for a deal to upgrade. The rock you will drill in 2030 is, to a first approximation, the rock you hold now.
The capex lever has been squeezed nearly as flat. Everyone in this industry knows the D&C story, because everyone helped write it: drilling and completion costs down roughly 25 percent on an indexed basis since 2015, a fall purchased with type curves calibrated to the lateral foot, day rates benchmarked in near real time, whole conferences about proppant intensity, and a cottage industry of data vendors making sure no operator ever bought a frac job blind. Finding and development costs for the public group now run near $10 a barrel. The wells got cheap because an industry pointed everything it had at making them cheap.
Operating costs came down about 5 percent over the same stretch.
Running a well is not four times harder to analyze than drilling one. The optimization followed the capital, and for a decade the capital went into building wells. That was the right order; the wells were where the money was.
It isn’t anymore. Inventory is finite and the industry now says so in public, and the capital stack has learned to count operating dollars: coverage tests, waterfalls, RBL redeterminations, and a dividend somebody promised in a deck two CFOs ago. When production flattens, LOE stops being a line item you manage and becomes the margin, and the margin is watched by people with remedies.
What the Decks Call Miscellaneous
If the rock can no longer be upgraded, the deals have to pay for themselves somewhere else, and the acquirers have been specific about where. Chesapeake and Southwestern announced $400 million of merger synergies and itemized them: roughly $200 million of corporate and regional overhead, $130 million from drilling and completions, and $70 million of “miscellaneous operating cost cuts.” That $70 million line is the most detail any deck in the consolidation wave has offered about operating costs. The one deal that itemized opex called it miscellaneous.
The sequence inside those numbers repeats at every acquirer, and what sets the order is certainty. G&A goes first because it’s the cut a headquarters can execute on itself, quickly, with near-total certainty. ConocoPhillips told the market its Marathon synergies would reach full run-rate inside the first year, and the only things that capture that fast are severance and systems. Capex goes second, rather mechanically, because D&C spend concentrates in a few large categories (rigs, frac fleets, tubulars, sand) that get bid all year and benchmarked to the decimal, with the leading-edge price visible to anyone who asks; hand a bigger program to that market and scale converts to price nearly on its own. Diamondback lumped capital and operating savings into a single capital-dominant $325 million line; Exxon and Chevron framed theirs around capital efficiency and streamlining. Read enough of these decks and the shape repeats: overhead first, well costs second, and the operating line somewhere near the footnotes, small and vague.
A well-run large cap carries cash G&A somewhere around $0.60 to $1.00 a barrel; LOE runs $5 to $8 (round figures, and the point survives any reasonable version of them). The playbook’s first and surest harvest is roughly a sixth the size of the bucket it never systematically touches. The reason is structural, because nobody would design it this way on purpose. LOE spend fragments across hundreds of vendors. Decision rights sit out at the field level, and the contracts auto-renew on staggered dates, so no single renewal ever feels worth a fight. The same merger that hands you a bigger rig program to bid also hands you a bigger compression book with the same regional vendors, and only one of the two arrives with a benchmark attached.
There is also a clock on this. Integrations sequence themselves: G&A in year one, capex in the first full program year, field contracts whenever they roll off, which takes two to four years. The deal class of 2023 and 2024 is arriving at the field-contract stage of its sequence right now, in 2026, with the buying power those mergers created at the LOE line still sitting where the mergers left it.
Kalibr’s recommendation cuts against that whole timetable: a compression plan inside ninety days of closing. Read the full inherited book against the market while the integration mandate is still live, map the roll-off calendar, price the alternatives, and decide once what the book is worth and which renewal executes which move. Close is when your leverage peaks: the combined book is a prize a vendor will reprice its whole posture to win, and it’s also the only window in which an operating-cost number can still make it into the synergies the market grades you on. Wait instead for the renewals to arrive one at a time and each will be too small to fight, forever; the staggering does the vendor’s work for it. We closed an engagement in July that is exactly this play, run on an Eagle Ford book that came out of an acquisition looking the way books look after M&A, and it puts an annual dollar figure on what the drift costs. That one publishes as its own piece later this week. The fair defense of the acquirers who wait is that a ninety-day plan needs an input nobody hands you at closing, which is what the inherited book should cost. The industry does have a standard way of answering that question, and it fails in a specific and expensive way.
A Grade Without a Gradient
The standard answer is the peer benchmark. Pull LOE per barrel for a dozen comparable operators out of their filings, adjust for whatever seems adjustable, and see where you land. Second quartile: fine, next agenda item. It’s how every operator I’ve ever sat with answers the question of whether they are good at operating costs, and it has the specific property of a good bureaucratic instrument, which is that it produces a defensible number while committing nobody to do anything.
The gentle failure is comparability. Mix, basin, well age, lift type, and accounting policy all move the number, and the nastiest version is ownership structure: rented compression sits in LOE, owned compression sits in D&A and maintenance capital. Two identical operations will print different LOE per barrel because of a lease-versus-buy decision somebody made a decade ago, and a workover policy can capitalize costs into the same invisibility. The benchmark compares documents assembled under different rules.
It gets worse, because the curve itself is circular. Your peers have no should-cost models either; the quartile you land in was set by companies with the same blind spot, negotiating with the same vendors. If every operator in a basin overpays the same compression fleet by 20 percent, second-quartile LOE means overpaying in above-average company. The industry is grading itself on a curve set by the ungraded.
And the worst of it is the denominator. Unit LOE is a fraction, and the bottom of the fraction is production. A high-productivity well dilutes fixed operating cost across more barrels, so great rock prints as operating competence and a mature asset prints as operating failure, before anyone has looked at a single contract or a single org chart. The LOE league table is substantially geology wearing a cost costume, and geology is the thing Novi already grades. The same confound that sorts the recycle-ratio quartiles contaminates the industry’s only benchmark for the one line the playbook left behind.
Even a clean peer number would answer the wrong question, because a benchmark with no decomposition cannot say why you are high: your water cut, your contracts, or your org chart. It hands you a position and no path toward a better one, a grade without a gradient. The distinction gets expensive at a negotiating table. Walk into a renewal with a peer benchmark and you have a talking point: “We believe this rate is above market.” The vendor, who priced half the market, is welcome to disagree, and will. A should-cost build sends you in with a BATNA that has a dollar figure on it, and prices move when the counterparty can see what you will do if they do not move. Negotiations run on BATNAs, and the industry has been showing up to the table with quartiles.
The Cheapest Points on the Board
Take the recycle ratio apart and ask what a management team can still move. The denominator is geology plus that decade of squeezed capex. In the numerator, price comes off the strip, mix is whatever the rock gives you, gathering and transport were contracted years ago, severance taxes are statutory. What’s left is lease operating expense. Round numbers: $20 of operating cash flow per barrel over $10 of F&D is a 200 percent recycle ratio. Find one dollar of LOE and the same barrel prints 210. Pulling those ten points out of the denominator instead takes another 50 cents off F&D, a 5 percent gain in the single most-optimized capex program in industrial America.
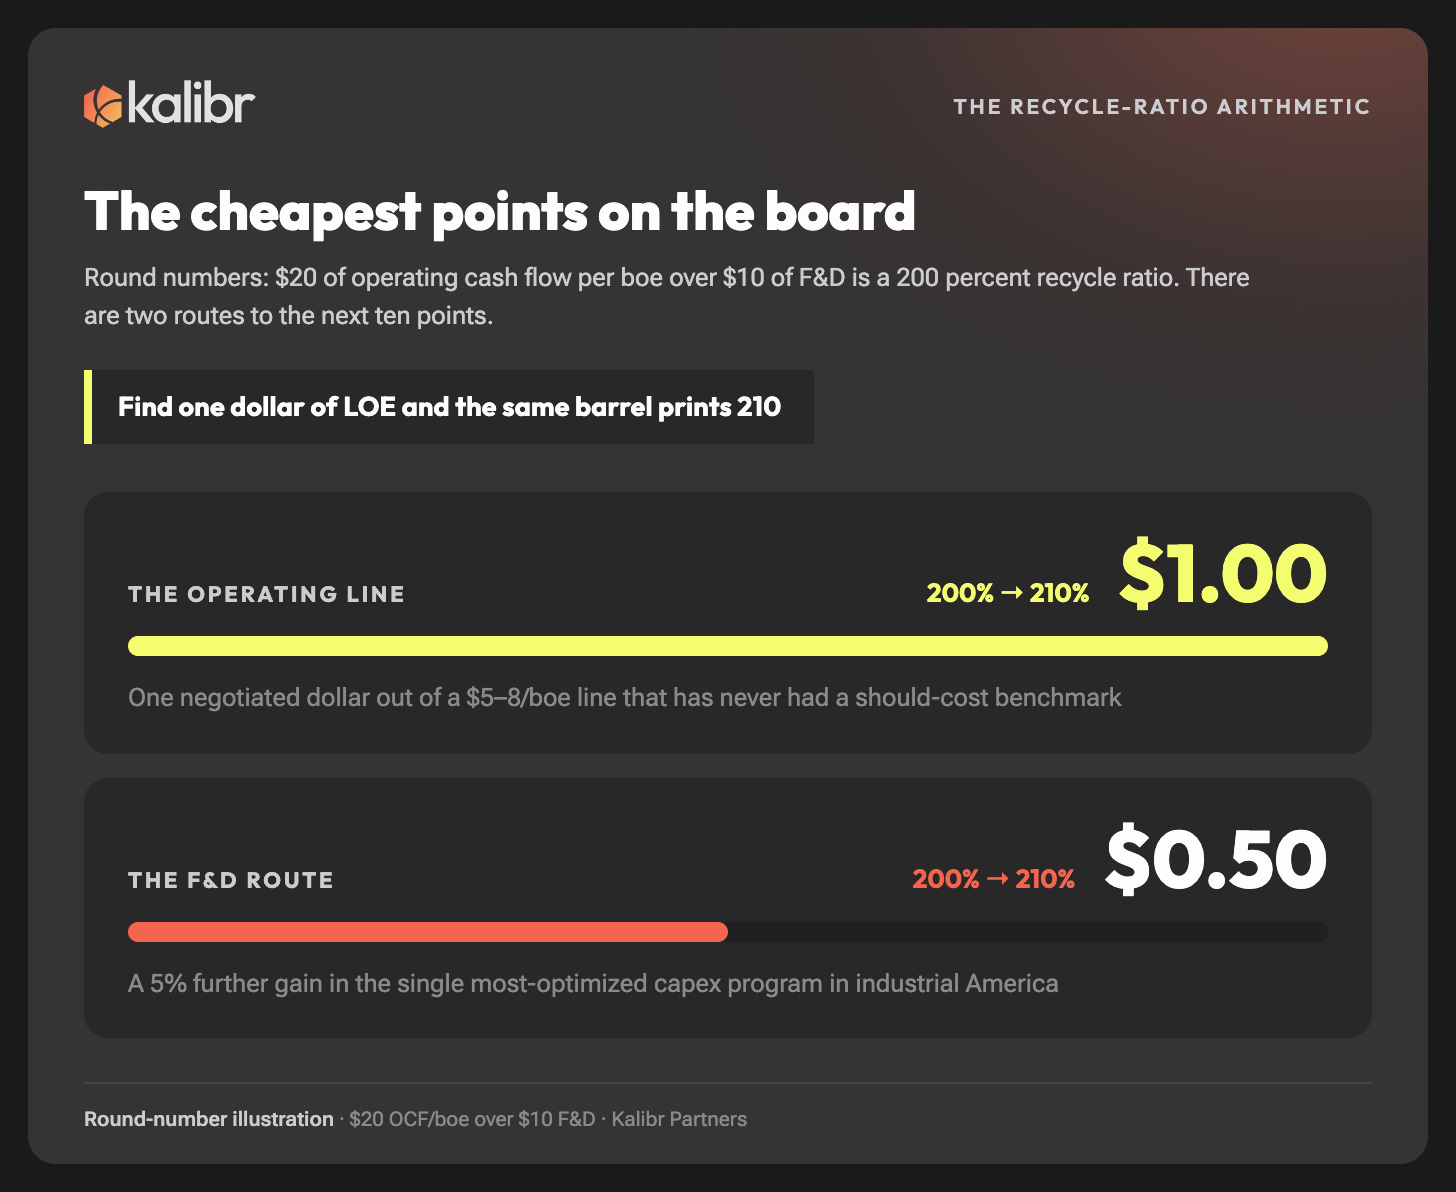
Scale the dollar and it stops being housekeeping. The public E&P group produces call it 18 to 19 million barrels equivalent a day, so a dollar of LOE across the group is roughly $6.7 billion a year of pre-tax cash flow, about what the entire consolidation wave announced in cost synergies ($5 to 6 billion at announcement, closer to $7 billion after the raises), and capturing it requires buying nobody. At a 10x multiple that is $65 to 70 billion of equity value, priced off the same line the decks call miscellaneous.
The same arithmetic lands at any scale you run it. A Diamondback-shaped company producing 850,000 barrels equivalent a day (round figures again) finds about $310 million a year in a dollar of LOE, roughly the size of the $325 million synergy line its actual merger announced, and the announced version cost $26 billion of equity. And if you produce 50,000 barrels a day at $7 of LOE, the bill is $128 million a year, roughly $75 million of it vendor-paid and contract-governed: compression, water, chemicals, rentals, power. A managed program that takes 10 percent out of that spend is $7.5 million a year, about $0.41 a barrel, four recycle-ratio points. Finding the same four points in the denominator means squeezing another 2 percent out of a capex program the industry has spent a decade squeezing.
Benchmark to the Model
The alternative to the curve is a model. Take every line of LOE you pay under your own operating conditions and build what it should cost from the ground up: molecules at index prices plus freight and blending, horsepower at engineering cost plus a maintenance schedule and a reasonable margin, water at whatever the hydraulics of your actual gathering system say it should cost. Then benchmark your invoices against the build instead of against your neighbors, and let the gaps set the strategy. A peer benchmark locates you in a lineup of companies that have never run this exercise. The model prices the prize, line by line, and names what you would have to believe to capture it.
What the gap gives you is an escalation ladder, and the point of the model is that every rung arrives priced. Round numbers: an operator pays $12 million a year for a chemicals program, and the bottom-up build (molecules at index, freight, blending, logistics, field service, and a margin nobody would be embarrassed by) says $9.5 million. Rung one is the conversation: a $2.5 million gap, in writing, with the arithmetic attached. Rung two prices the incumbent’s service layer, the techs and telemetry and program management, at replacement cost, call it $900,000, which shrinks the defensible gap to $1.6 million and ends the part of the meeting where everyone asks everyone to sharpen pencils. The third rung is the commodity vendor who supplies the same molecules with a thinner service layer, credible because the model just proved the molecules are most of the program. The last rung, direct sourcing, index procurement and tolling and two hires, almost never executes, because it almost never has to: the calculation is the BATNA, and the vendor’s knowledge that you have priced a rung is usually what keeps you off it. (When we ran this play in print last year, the model argued against our own client’s position on hydrate inhibitors, which is the kind of thing that happens when the model is real.)
The model also has a second job, which is underwriting. Point it at an acquisition target’s lease operating statements and it re-prices the book under your operating model, line by line, and finds what a haircut on the seller’s history cannot: compression rented 20 percent over market with roll-offs in 18 months, water hauled at legacy rates, and, cutting the other way, the target whose LOE is artificially low because a below-market contract expires eight months after close. Hilcorp built a franchise on operating-cost gaps rival bidders could not price. The rock is transparent and locked; the operating model is the last private edge in A&D, and it takes a standard to measure it.
Both jobs carry the same caveat, the one that keeps should-cost work out of consulting theater. A should-cost gap is an engineering floor, and supply-constrained categories clear above it. Compression is the live case: with engine lead times past two years, a vendor can know your model is right and decline to meet it, because the units you’d defect to don’t exist this year. So the standard needs a second layer, a market layer: who has iron where, what utilization looks like, whose contracts roll when, how long the queue for a replacement unit runs. The model prices the gap, and the market layer says how much of it is reachable this year. Run the model alone and you will promise your CFO savings the queue will not release. Market data alone is just the quartiles again.
Kalibr starts the program at compression, and the reason is arithmetic. Every other line in LOE is a cost: win the negotiation and the invoice shrinks. Compression is a cost bolted to a throughput guarantee. The machine determines whether the gas flows at all, so the same contract carries a rate and an availability clause, and availability is production. Downtime also works the metric from the other side, because a fleet that runs poorly shrinks the barrels you divide the spend by; unit LOE deteriorates at constant spend. A compression negotiation that reads only the rate captures half the value on the table; the Eagle Ford engagement, when it publishes this week, puts dollar figures on both halves.
Shale Has No Operating Ratio
Line up the instruments the industry has built around every other input. The rock is graded by the section, by machine-learning shops that sell the grades. The D&C program has the benchmarking industry that produced the 25 percent. Price you can hedge on a listed strip. And LOE, the last discretionary line, the ten-points-a-dollar line, gets one entry in the 10-K, a blend of water, chemicals, power, compression, and labor, defined a little differently at every company that files one. Harrison’s trade was underwritable because the operating ratio is computed identically at every carrier on the continent; an activist could price a doctrine from a public number. Nobody can run that play on a barrel’s operating cost, because the compass the play needs does not exist. It has to be built category by category, engineering floor and market layer together, and the place to start is the largest category nobody has ever been able to see whole: the machine layer that moves the gas itself. The rest of this piece is about counting that layer, and it starts, of all places, with hotel rooms.
The Number You Cannot Buy
If you want to know how many hotel rooms there are in Dallas, you can buy the number; somebody maintains the count for anyone building a hotel, lending against one, or shorting the people doing either. Rigs get counted every Friday, and have been since before your grandfather’s first well. Cattle get counted. Container ships get counted by people who have never seen the ocean. A market with real money in it tends to acquire a census; every other number stands on one.
Now ask how much installed compression horsepower is running in the Permian.
There is no number. Walk the request up through every subscription your company pays for and you come back with the fleets the public compression vendors disclose in their filings, an estimate stapled to those disclosures, and silence. Compression is the machine layer that moves nearly every molecule of gas in this country from a wellhead to a pipeline. The fleet took decades and tens of billions of dollars to install. It burns fuel, throws rods, and reprices, and at no point in any of that does it pass through a public count.
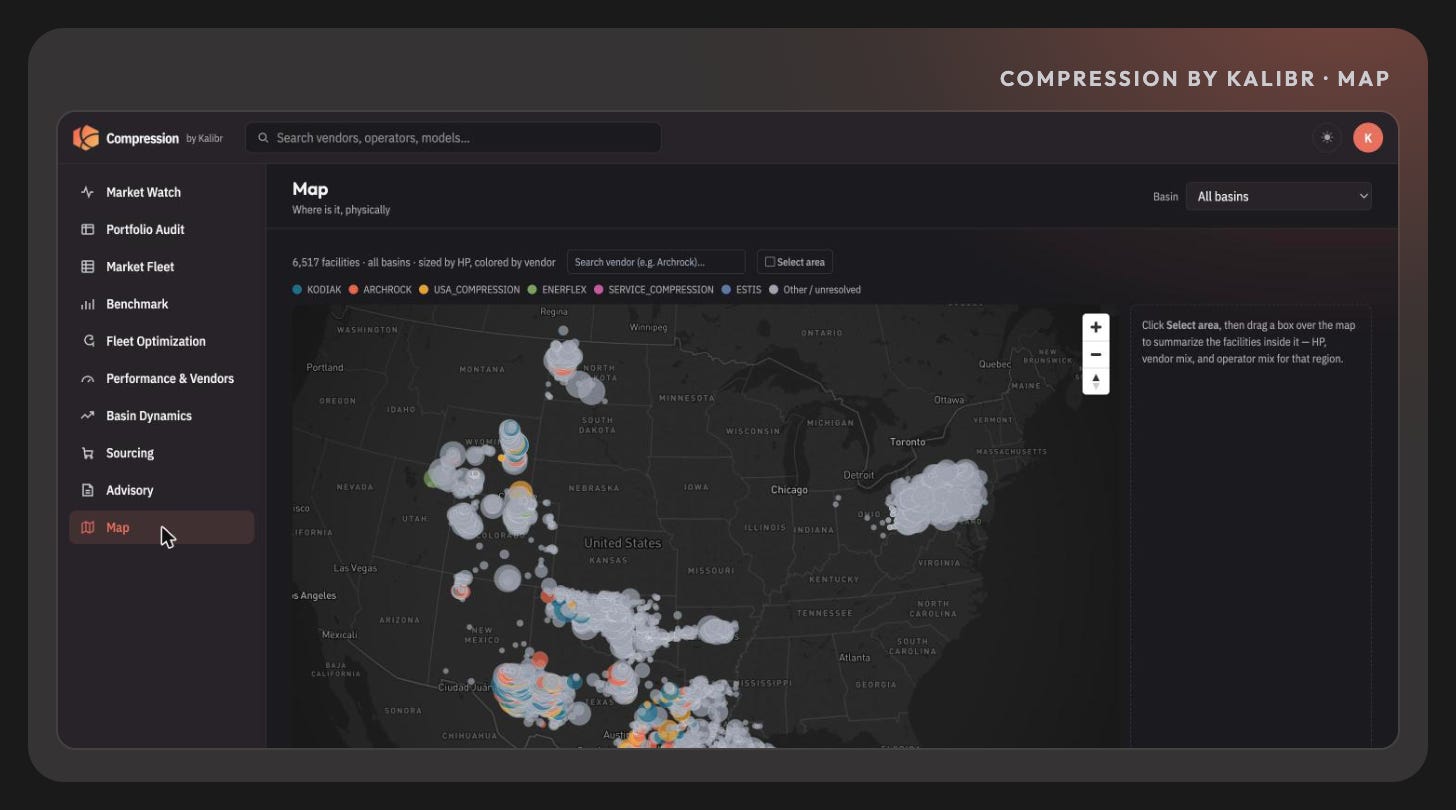
This would be a bar-trivia observation except that a lot of capital is currently pricing off the absence. Research desk after research desk has initiated on the public compression names this year with some version of a “compression supercycle” thesis, and the underlying story is real: gas demand is rising, engine lead times have blown out past two years, and the fleet is tight. But every one of those reports has to size the market before it can hand out shares of it, and the market they size is the one the filings can see. The denominator underneath the whole discussion is an estimate of an estimate. Nobody was hiding it; it just wasn’t anywhere.
Why it wasn’t anywhere is a story I won’t bore you with. The short version is that every market-size figure you have ever read divides by the sellers, the fleets that file, while the operator-owned side of the market files nothing. Fixing that took the last two years.
We Counted the Machines
So we counted the machines. All of them, across twelve basins, reconciled against every fleet disclosure that exists, with a vendor assignment modeled onto each unit and a confidence score sitting next to it admitting how sure we are. For the one public vendor where a serious top-down basin estimate exists, we built the same figure bottom-up, unit by unit, and the two constructions land within about a point of each other (which is either reassuring or suspicious, depending on your priors; I’ll take reassuring, since neither construction knew about the other).
The count has a scope sentence, and the scope sentence is as much the product as the number is: “Permitted field and gathering compression, ≥200 HP, excluding processing-plant and transmission compression, reconciled bottom-up where public disclosure allows.” Every word in it is a decision about what to include, and the decisions move real money. Apply that sentence strictly and one mid-continent basin’s total falls by roughly half, because so much of what sits there is plant and pipeline iron that a field-compression census has no business counting. Publishing the scope is what turns the count into a number you can argue with, which is the only kind worth citing.
A denominator does not occur in nature; somebody has to assemble it. It is not a better estimate of the same thing the analysts were estimating. It is a count of a population the estimates were never able to observe.
A Category With One Occupant
Kalibr has repositioned, and the new website says what we now are: the should-cost standard for OPEX, built on the compression census nobody else has. The site calls the category “operating-cost intelligence” and notes it is “a category with one occupant.”
But that’s not quite how I’d put it, and since it is our own copy I get to translate. “A category with one occupant” is a flattering way of saying nobody has checked our work yet, because until recently there was no work to check and the market has not had a chance to kick the tires. That is why the scope sentence is published and every row carries a confidence score. A reference you cannot interrogate is a brochure. The RSMeans model, the one every mature construction market runs on, works because the reference is public enough to argue with and consistent enough to win the argument over time, which is the job we are applying for.
The origin story is short. We spent years on the operator side of renewal tables where the vendor knew the whole market and we knew our own contracts, and the difference showed up in the rate. Consulting closed that gap one negotiation at a time. The census closes it structurally. We built the thing we spent years staring at from the wrong side of the table.
You Can Take the Data With You
The census ships inside a platform now, called Kalibr, and I want to show you one screen of it rather than tour you through ten.
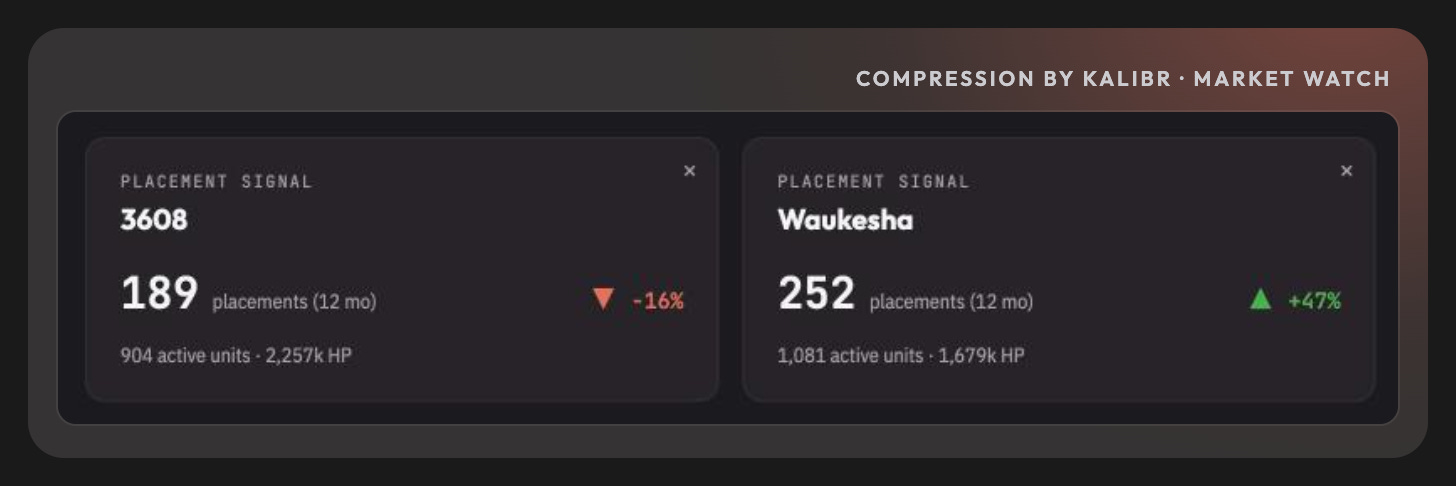
This is Market Watch, the tab I keep open. Those two cards are placement signals: new units of a given engine family arriving in the census record, trailing twelve months. The Cat 3608, the workhorse of large-horsepower compression, printed 189 placements over the last year, down 16 percent. Waukesha printed 252, up 47 percent. (The hot engine family of 2026 is a brand from Wisconsin that started building engines in 1906. Gas compression is not a fashion industry.) If you sell compression, that pair of cards is telling you where the placement mix is moving while your competitors wait for a quarterly call to surface it. A renter reads the same cards the other way: which iron is getting scarce, before the scarcity reaches your renewal quote. There are eight more tabs and I’m not going to walk you through them; you can click faster than I can describe.
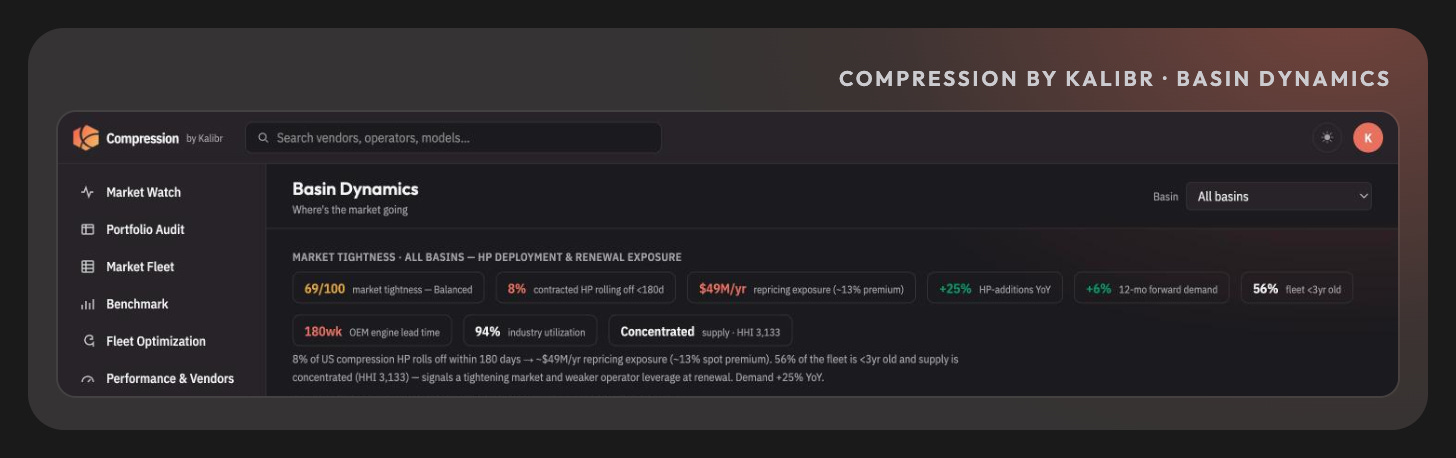
The part of the platform I most want you to notice is a pricing decision. You have bought market data before, so you know the incumbent shape: a seat license, then an add-on module that turns out to hold the thing you needed, then an API that meters by the row, so that getting the data into your own models costs more than the dashboard did. The whole model assumes the dashboard is the product and your access to what sits underneath it is a second sale.
We priced it the other way. Every row in the census is reachable by API and MCP, “no gate, no upcharge”; connect and pull it into your own warehouse or your own agent. The site copy says “we hand you the keys with the subscription,” and for once the copy is the spec.
The Kalibrator Runs the Checklist I Used to Run by Hand
The piece of the platform I would have called science fiction back when I sat across from the vendors is the one you type at. We call it the Kalibrator. You ask a question in plain English, it writes the query against the same rows you just read about, runs it read-only, and answers with the table and its reasoning attached. Everyone has a chat box by now; the interesting part is what got put into its head. The Kalibrator carries the Kalibr method itself, the five checks we run in every operator engagement: contract roll-off timing, vendor leverage screening, rate benchmarking, RFP field qualification, and basin demand with term selection. Ask it about a renewal and it goes looking for your basin’s roll-off calendar and the vendor’s financial posture before it says a word about tactics, because that is the order the method runs in.
And it inherits the house discipline, which for my money is the pitch. Ask it a rate question and the percentile band arrives before the midpoint, because a single number without the band overstates precision. Thin cells get suppressed rather than extrapolated. The phrase it uses is “modeled renewal window,” never “contract expiry,” because we model the window and the difference matters at the table. When a query comes back empty it says so, and says why.
The Free Layer Is Built to Be Cited
You will have noticed this piece never printed the census totals. That is deliberate: articles rot, and a count belongs in a container with a stated scope and a version history. The container is called The Iron Count, a Kalibr basin census brief, and it’s free. One basin per issue: every compressor set in that basin, with its operator, its vendor where the attribution clears our confidence bar, its engine family, and its build vintage, counted from the public regulatory record and given away. The first cycle covers the major basins one Wednesday at a time, the Permian in front, starting next week, and the reason the series exists is the negotiation you are probably in. Engine queues run 200 weeks, spot rates near $30 get quoted against legacy paper in the low $20s, ten-year lock-ins arrive with a straight face, and all of it is being negotiated on vendor talk, because no public filing names a single compression vendor. The count is the only public map of who runs whose iron.
The brief’s discipline is the platform’s discipline. Every figure carries a chip naming its source, census, vendor-stated, or analyst estimate, and census figures never blend with vendor figures in a single number. Vendor attribution prints as a floor, never an inference. Thin cells get suppressed. The citation line is on the cover, “The Iron Count, Permian, No. 01,” and being cited is the point (this is also an ad; the count is still free).
The free layer holds the iron (who set it, who runs it, what engine, what vintage) and holds back the rate work, the forward paths, and the unit-level tables; sizing the market and mapping its owners is the free good, and the rows are the business. Giving the count away is the proof we hold the denominator, because everything you would want to divide by it is a conversation.
Getting it costs a free subscription to this list, nothing else. The briefs arrive as their own Wednesday send, and nobody calls you unless you ask.
The Four Doors
That neutrality governs the data, and I want to be precise about where it stops. Above the data, Kalibr still does the thing it was founded to do, which is take a side, one engagement at a time, out loud (the masthead at the top of this email states the rule). The new site calls the menu the four doors and ranks them by how involved you want us, with a caption apiece: “you run everything,” “we arm you,” “we are on call,” “we are in the room.”
The first door is the data; this entire article has been a walk through it.
The second is Custom Intelligence, the working core of the firm: your negotiation run through the machinery before you walk in, the counterparties scored, the leverage read, the structures to demand and the order to demand them in, everything a consulting engagement would deliver short of sitting at the table. It points both ways. An operator gets the renewal read; a seller gets the pipeline scored before the first pitch, the whitespace ranked, an account list in the order the census says to call it.
The third door is The OPEX Desk: “a seat, not a project,” Kalibr’s cost function on retainer across every operating line, for operators who never built a procurement function and do not intend to. A vendor’s escalation letter arrives and the Desk answers it with the should-cost floor and the vendor’s own economics, whichever line is on fire that month. Escalation letters are priced to the least-informed buyer in the basin, and the Desk’s job is making sure that is no longer you. The Desk runs a limited book, on purpose; it sells expertise and hours, and neither stretches.
The fourth door is consulting in the shape you already know: the full negotiation, run end to end with your team. One of those closed in July, on an Eagle Ford compression book that came out of an acquisition looking exactly the way this article says books look after M&A, and it is this week’s second send, names removed, numbers left in.
What Tuesday’s Email Is Becoming
Starting next week, the recurring cuts of the same system begin publishing on a calendar. Tuesday mornings stay this commentary, 3,500 words of argument with numbers in it. Wednesday mornings belong to The Iron Count: one basin per issue, every covered basin every quarter, each cycle reprinted on the fresh count. Thursday mornings carry the asset layer, what the iron itself is doing, and Sunday afternoons the market layer, what the money around the iron is doing; those posts are short, 800 to 1,500 words, one mechanism and one table each, built from the same warehouse the platform reads. The Sunday send was timed with a seller’s Monday meeting in mind. If you rent instead, the iron does not change shape depending on who reads it; the masthead has said so all along.
Thursday belongs to the asset layer, rotating through four series. The Iron Ledger is the census delta: who set what iron, where, in the trailing 90 days, which no other public record shows. Engine Room reads the engine mix as the supply chain it is, Caterpillar against Waukesha, 3500-family against 3600, fleet age by basin, and what the mix says about who is stuck in the two-year engine queue. Whitespace Watch maps the addressable market a vendor BD team faces: the unattributed fleet, the gas-lift conversion signals, the operators adding horsepower. And Uptime League publishes facility-level compression uptime, derived from production data, a number that exists nowhere else at any price.
Sunday belongs to the market layer. Rate Surface Monthly prints the spread between in-place and leading-edge rates by basin and horsepower tier, with the forward path attached. Renewal Radar is the repricing calendar: how much horsepower enters a renewal window in the next 90 and 180 days, where month-to-month exposure sits, who defends and who attacks. Claims vs Census runs on earnings timing and does what the name says, putting reported utilization next to normalized utilization next to what the assets show (the definitions differ by vendor, and the differences are the story). The Signal Monitor scores the six conditions that would break the compression market’s current equilibrium, and tracks which one moved this quarter.
Earnings season bends the rotation. The vendor quarterlies land mid-quarter (the second-quarter prints are landing as I write this), and for the weeks right after them the data days run The Counterparty Read: one vendor per issue, the quarter taken apart, then the leverage read on the name, which terms it can concede, which it will defend, and what that means whether you compete with the vendor or rent from it. The first three are Kodiak, Archrock, and USA Compression, starting next week.
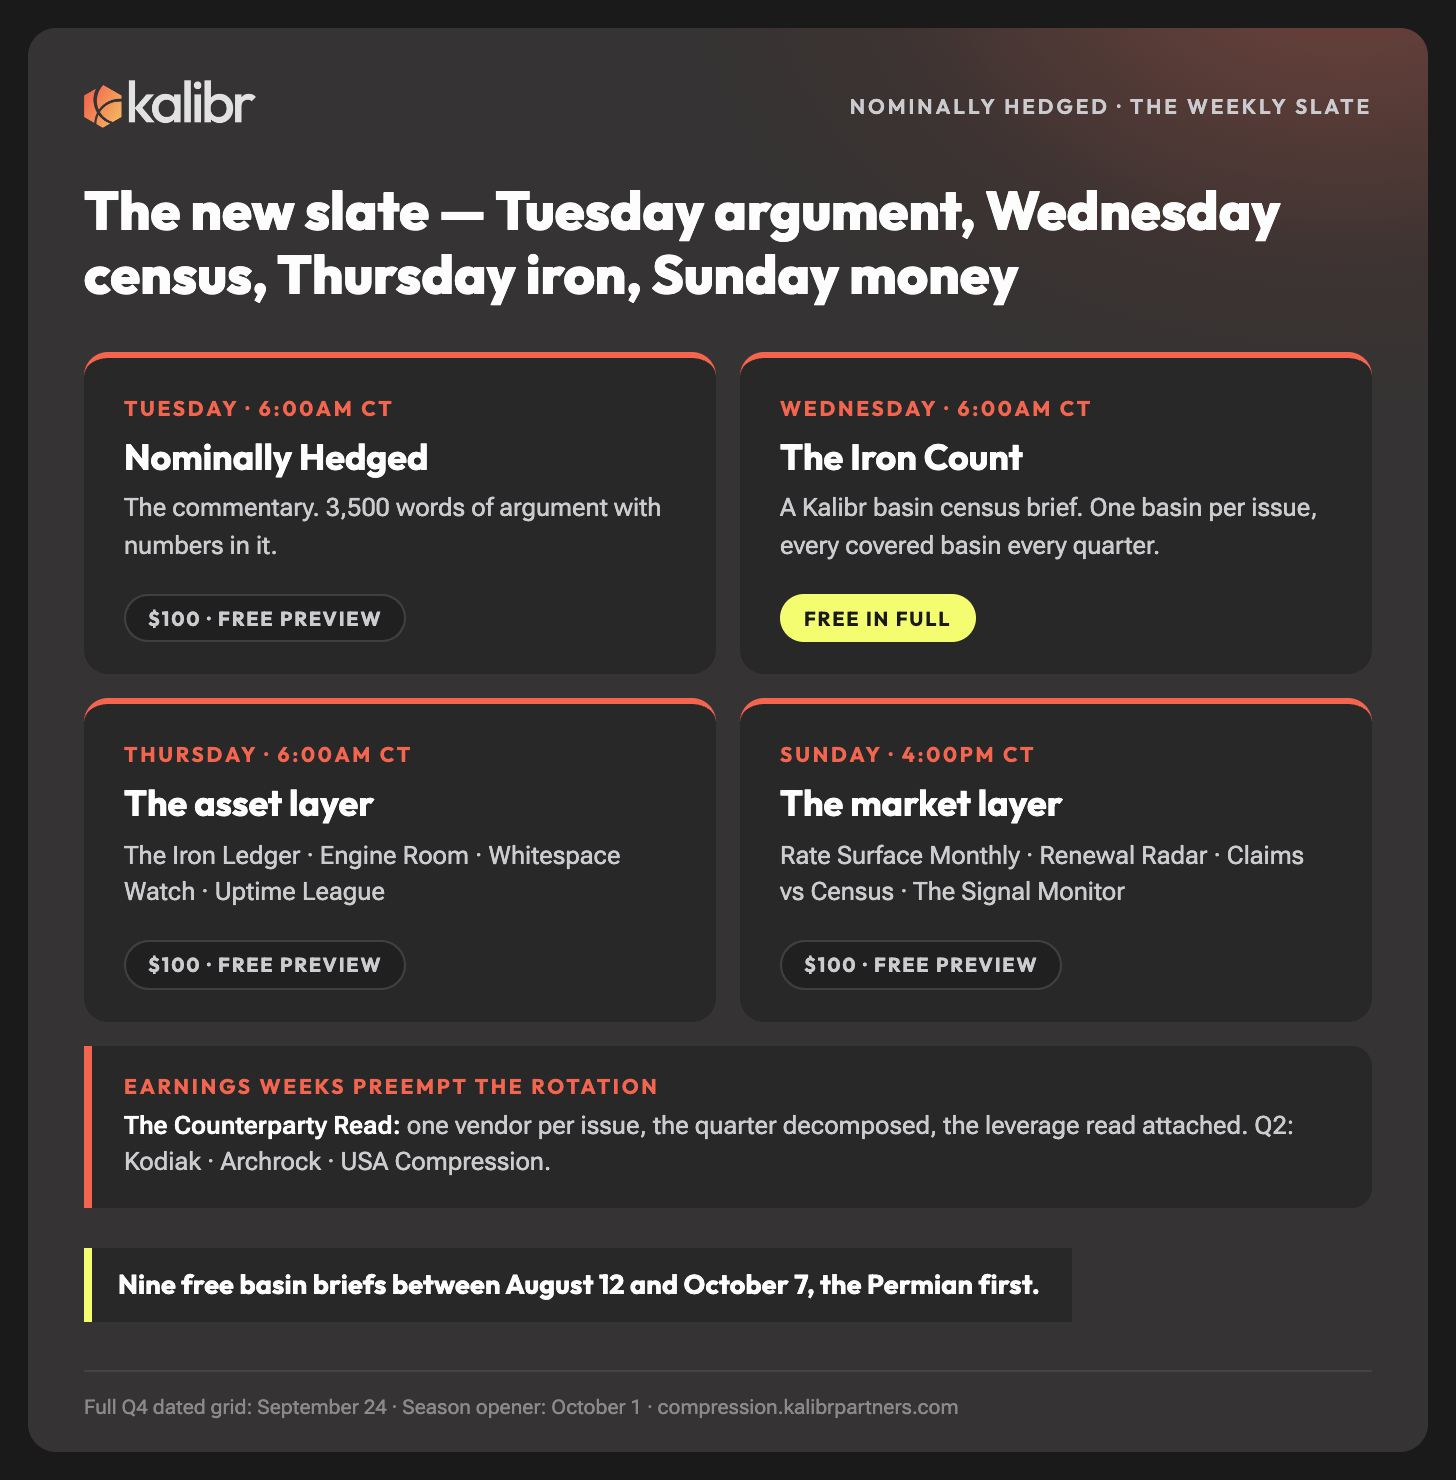
Every post cuts the same way, and the cut now includes Tuesdays. The free layer is the preview: the headline number, the direction, one chart, enough to know what moved, and on Tuesday the front of the argument. The $100 a month buys the full articles, Tuesday, Thursday, and Sunday: the commentary whole, and the data days with their tables intact, basin-level and tier-level prints, normalized, aggregated, no identifiable counterparty in them. The Iron Count is the deliberate exception, free in full every issue; it is the layer built to be cited. And above the newsletter sit the standing editions, quarterly reports carrying the raw granularity: the Basin Iron Report provides the competitive deployment map down to the unit; the Rate Book provides benchmark tables at the 25th, 50th, and 75th percentile by basin, band, and fuel; the Compression Demand Outlook says which basins and which quarters the next horsepower wave lands in; and the Counterparty Report provides the vendor-by-vendor negotiation dossier, written to survive being read by the vendor across the table. Anything bespoke beyond those routes to the customized work described a few sections ago. If one of those is the report you have been waiting for, reply and say which.
The rotation opens next week: the Permian count on Wednesday, Kodiak’s quarter on Thursday, Archrock’s on Sunday, USA Compression’s the Thursday after, and the regular series rotate in behind the earnings block. The full dated grid for the fourth quarter publishes September 24, and October 1 opens the first full-quarter season with a read of the third quarter’s census against what the fourth quarter should watch. Thirteen weeks a quarter, every quarter, with the recap posts publishing the next quarter’s calendar so you always know what is coming. If the weekly cadence was the reason you never upgraded, that reason retires on Wednesday.
Stay Hedged
I can see two readings of what a published census does to this market, both of them fair. The bull reading: the coverage has been sizing the visible slice, the whole market is bigger than the slice, and a larger denominator under a tight supply picture makes the “supercycle” thesis stronger. The deflating reading: a public reference number disciplines everyone’s story, and stories that survive checking are usually more boring than the ones they replace. Both come out of the same count, and I’m honestly not sure which wins.
The census is the first instrument of the compass this piece has been asking for; the others get built the same way, category by category, in public, and the calendar above says when. The reader’s move this week is cheap either way: take the free count when it publishes, put it under whatever compression story you are currently carrying, and see whether the story holds. If it holds, you lost an email address; if it doesn’t, you found out a week after finding out became possible.
Until next time. Stay hedged.
Nominally Hedged is published by Kalibr Partners. Reply, or message us directly, and we will point you to the read built for your side of the table.
This newsletter is research and commentary for informational purposes only. It is not investment advice and not a solicitation to buy or sell any security. The analysis draws on public filings and the public regulatory record alongside Kalibr’s proprietary asset data; figures are believed reliable but not guaranteed, and several reflect modeling assumptions stated in the piece. Unit- and vendor-level attributions reflect Kalibr’s modeling and carry the confidence levels noted in the text. Company names and marks belong to their respective owners.