


Nominally Hedged is Kalibr Partners’ briefing on what oil and gas actually costs: every category, CAPEX to OPEX, proprietary data systems, interpreted through a commercial lens. Whichever side of the negotiating table you sit on, you are the intended reader. The data is neutral: the iron does not change shape depending on who reads it. In any single engagement we sit on one side of the table, and we tell you which.
A frac bid is one of the more precise documents in oilfield procurement. It quotes you a rate to the dollar: so many dollars per stage, so many per pound of sand, so many per lateral foot, some of it carried out to a third decimal place, as if the third decimal were the thing that would win or lose you the well. The precision is genuine, and it is aimed at the wrong number. The figure that actually sets what a well costs does not appear on the bid to any number of decimals, because it does not appear on the bid at all.
A frac spread is rented by the day. Call it two hundred thousand dollars of it, which is roughly where the public arithmetic lands once you divide a listed pressure pumper’s revenue by its active fleets and its operating days. The real figure runs from about $187,000 at the lean end to nearly $300,000 for the highest-cost fleets, and $200,000 is a fair, round, conservative place to stand. The spread shows up, it pumps 18 to 22 hours a day, and it stays parked on your pad until the well is done. So to a first approximation, the cost of the well is the day-rate times the number of days. That approximation is also the whole game.
Everyone at the table negotiates the day-rate. The number of days barely comes up, which is odd, because the number of days is what actually sets the bill. It is not even a mysterious quantity. It is the length of the lateral divided by how fast the crew pumps it, which means the entire cost of the job rests on a single variable, completion speed, and completion speed is the one number that never makes it onto the bid you are comparing.
It appears nowhere because, until recently, nobody had it. You can put an exact price on a stage, because a stage is a thing you can count on an invoice. Nobody put a price on a day-per-well, because that would mean holding a stopwatch on every crew, on every pad, across years, and then asking the question the invoice never makes you ask: do two spreads with the same logo on the door pump at the same speed?
They do not. They are not close. The gap is not small enough to round away, and it is exactly the size that quietly decides which bid was the cheap one, long after you have signed the other.
This is a piece about that gap. How big it is, why your bid sheet cannot see it, and what it does to the price of a well once you can. For this example, we will use our data set for the DJ Basin’s frac fleets, one fleet at a time, and ran the bids back through it. The cheapest headline number, it turns out, is usually not the cheapest well. You can prove it from the iron up.
It Isn’t the Logo, and It Isn’t the Design
Start with the comparison everyone already makes, the one between the two companies. In the DJ, the two providers we can attribute pump at visibly different speeds: one runs a basin-wide median of 2,362 lateral feet a day, the other 3,198. Call it a 35% gap. That is a real difference, and if it were the whole story, leveling bids would just mean adjusting for it. Dock the slower logo 35% and move on.
That is the whole story only if the logo is the whole story. Look inside either one and the 35% turns out to be the small part.
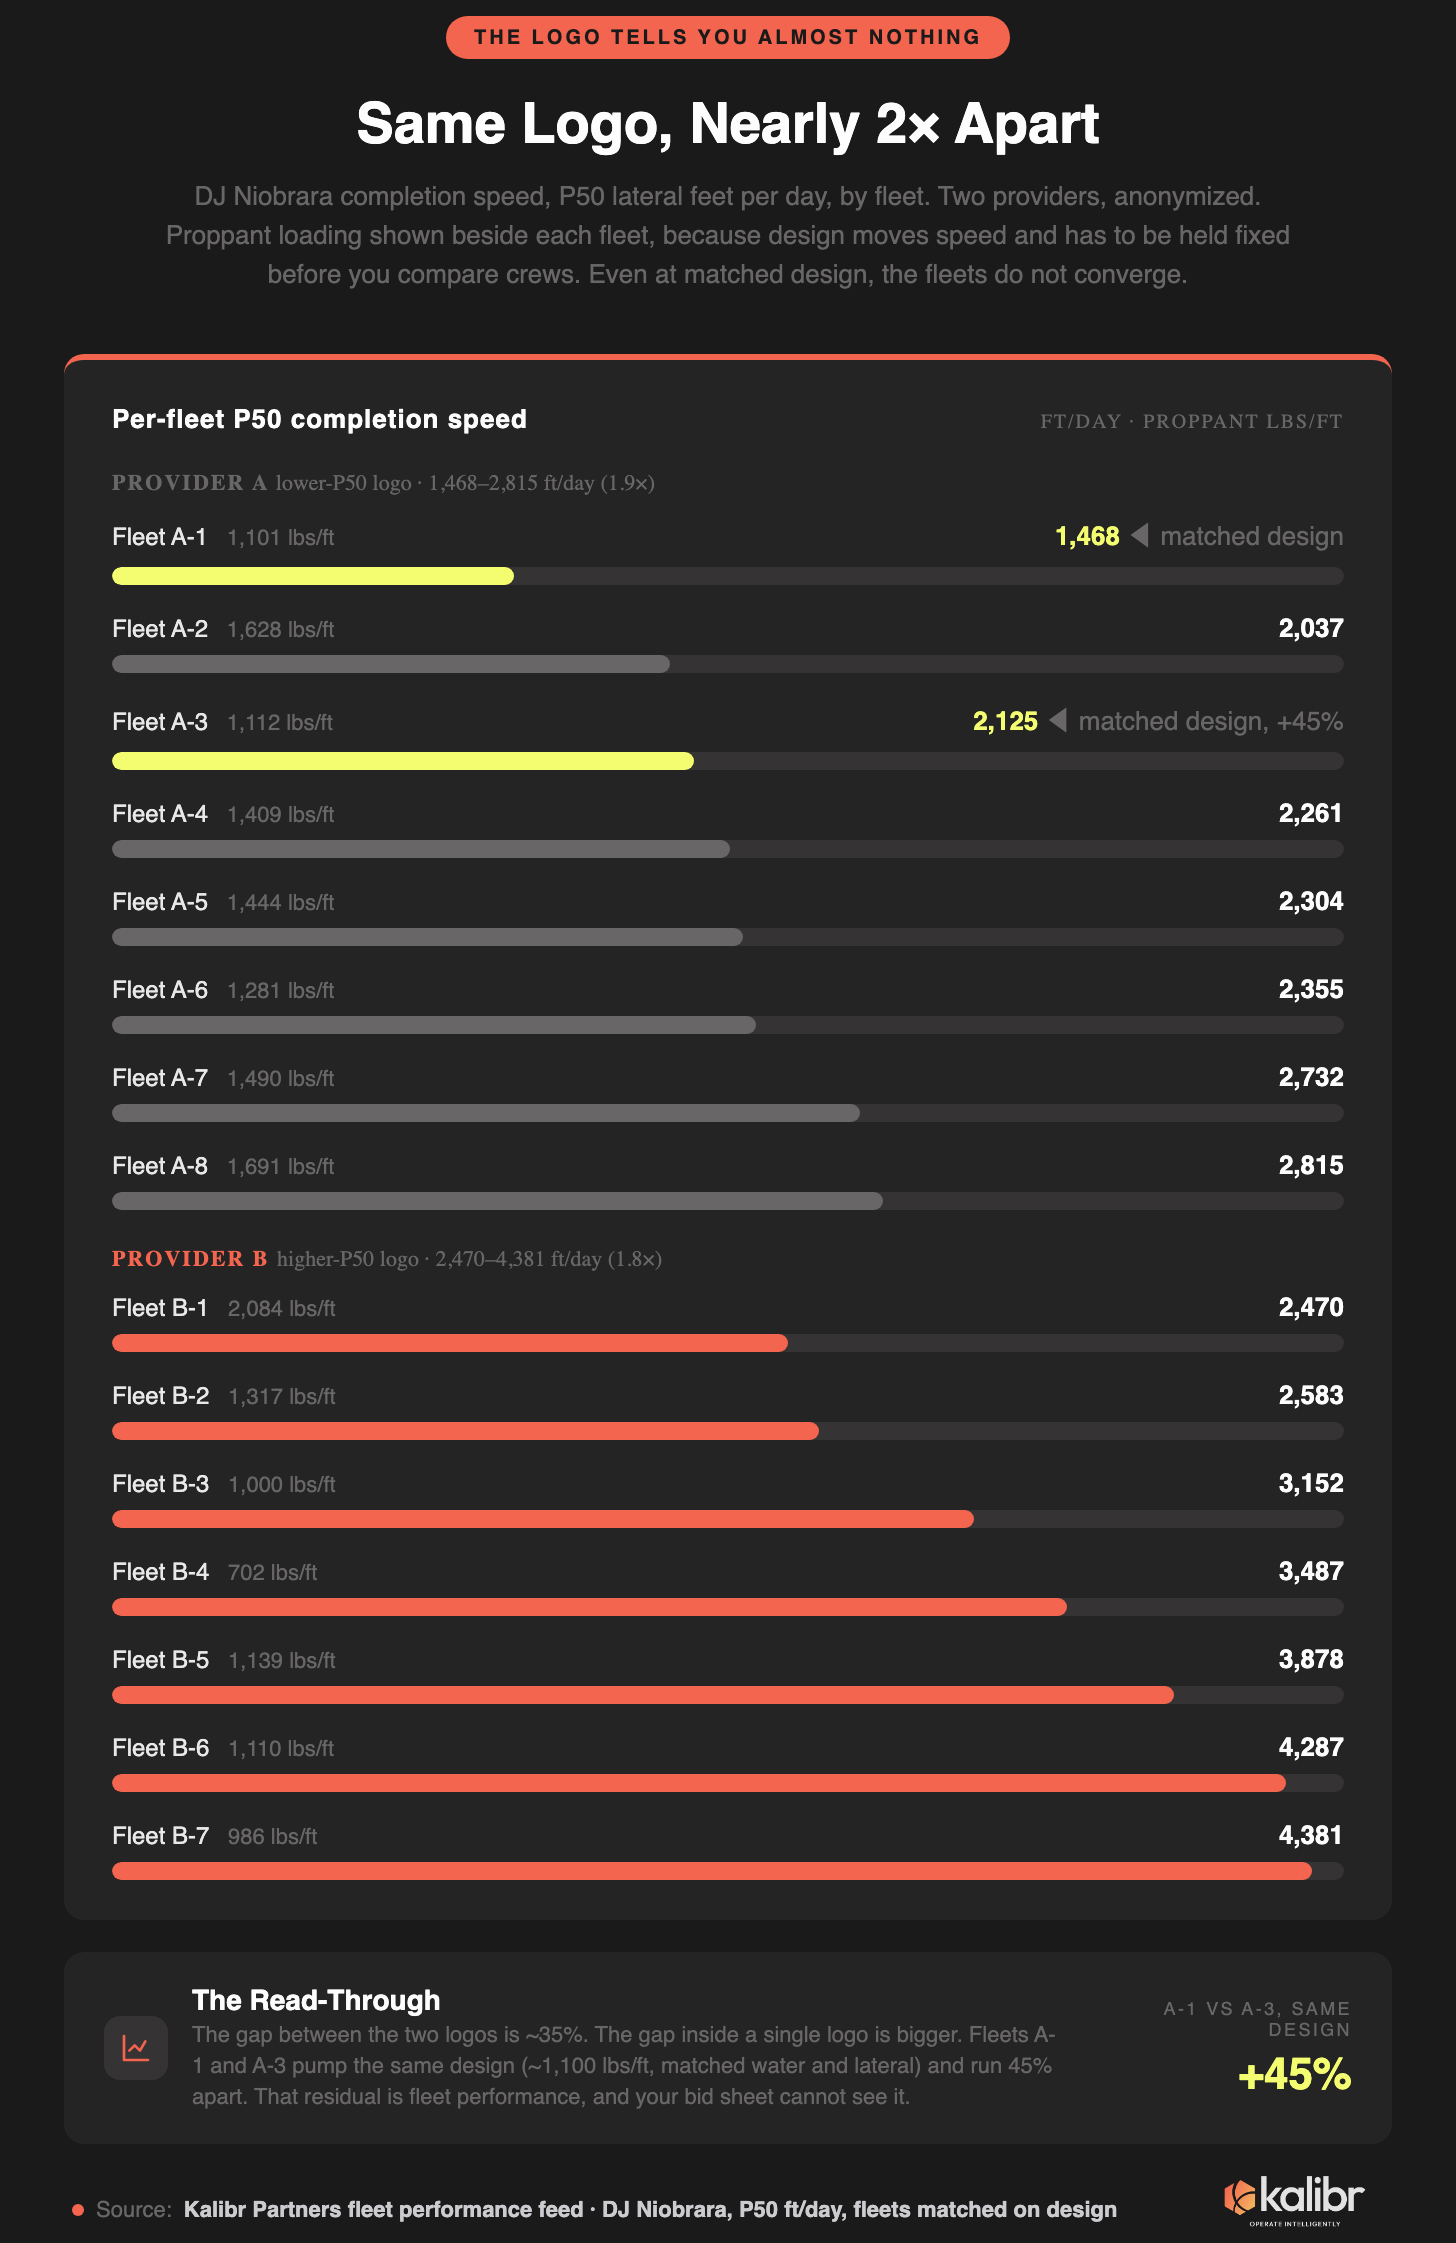
The slower provider’s own fleets run from 1,468 feet a day at the bottom to 2,815 at the top, a factor of 1.9. The faster provider’s fleets span 2,470 to 4,381, a factor of 1.8. So the gap between the two companies is 35%, and the gap inside a single company is nearly double that. Whatever you think you are buying when you pick a logo, a completion speed is not it.
Here is where someone in the room says the sensible thing, which is that not every job is the same. A fleet pumping a heavy, sand-loaded design will be slower than one pumping a light one, and that has nothing to do with the crew. This is correct, and it is the first thing the data confirms. Sort the basin’s jobs by proppant intensity and the speeds fall in a clean staircase: under 1,000 pounds per foot, the median fleet pumps 3,984 feet a day; at 1,800 pounds and up, 2,280. Heavier designs run about 43% slower, every time, for everyone. Design is a real variable, not a rounding error.
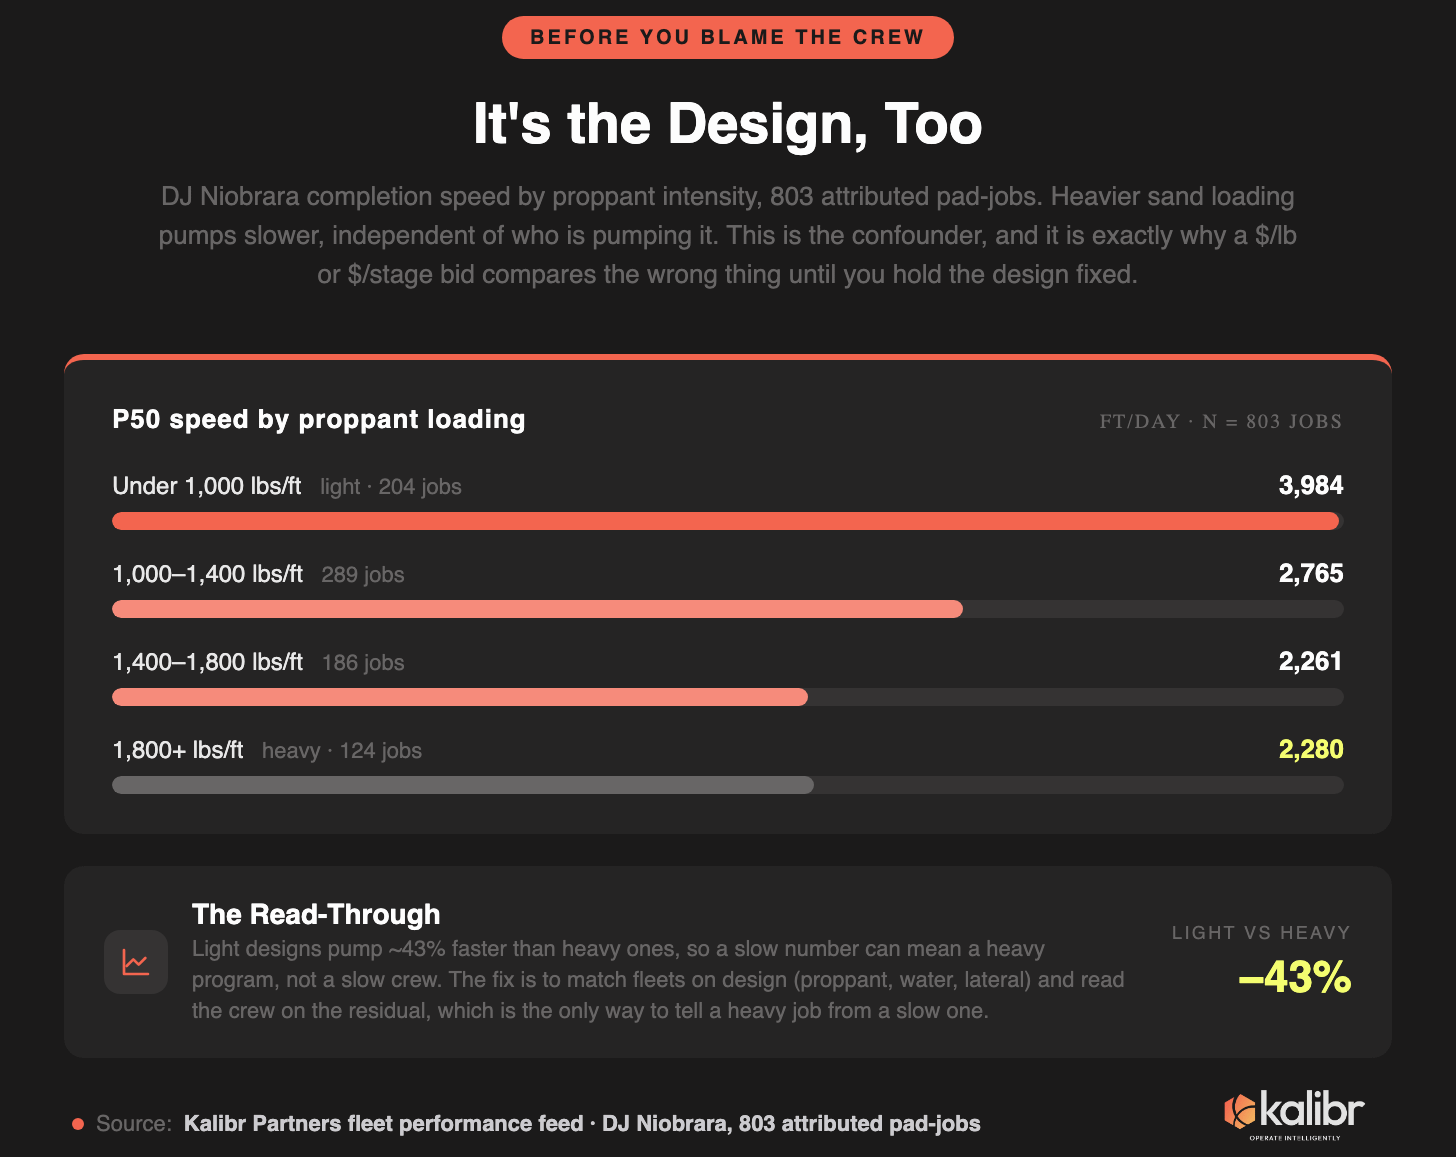
Which is exactly why you cannot compare raw feet per day blind, and exactly why the comparison that matters holds the design fixed. So hold it fixed. Match the fleets on proppant loading, water, and lateral length, and read the crew on the residual. When you do, the gap does not go away.
Look back at the slower provider’s fleets. A-1 and A-3 pump almost identical designs, about 1,100 pounds of proppant per foot, matched on water and on lateral length. A-1 runs 1,468 feet a day. A-3 runs 2,125. That is 45% more well per day, at the same design, under the same logo. Reach across to the faster provider and the matched comparison gets worse: A-3’s 2,125 against B-5’s 3,878, at the same loading, is an 82% gap. And design does not even fix the ordering. B-1 pumps the heaviest program in the basin, 2,084 pounds per foot, and still outruns several of the slower provider’s lighter fleets. If sand loading set the speed, that could not happen.
So the answer to “not every job is the same” is yes, and we account for it, and the gap survives anyway. The residual is the crew, the iron, the pad logistics, the thousand small decisions that make one spread fast and another slow on identical rock. That residual is the thing your bid sheet is built to ignore.
Operators know this, even when procurement does not. Occidental spent late 2023 deliberately cutting its Niobrara proppant loading from roughly 1,500 pounds per foot down to 800, and its Codell designs from 1,100 to 550, to improve capital efficiency and ease the mechanical strain that slows a job down. Civitas flattened its loading and cut fluid 23% to hold its execution steady. Both of them changed the days.
And that is where the money actually sits. Take that same $200,000 day-rate and run it across the basin’s operating band on a 10,167-foot well: the slowest fleet turns it into about $1.39 million of pumping cost, and the fastest turns the identical rate into $464,000.
That is a $921,000 swing on one well, and none of it lives in the day-rate everyone spent the RFP arguing about.
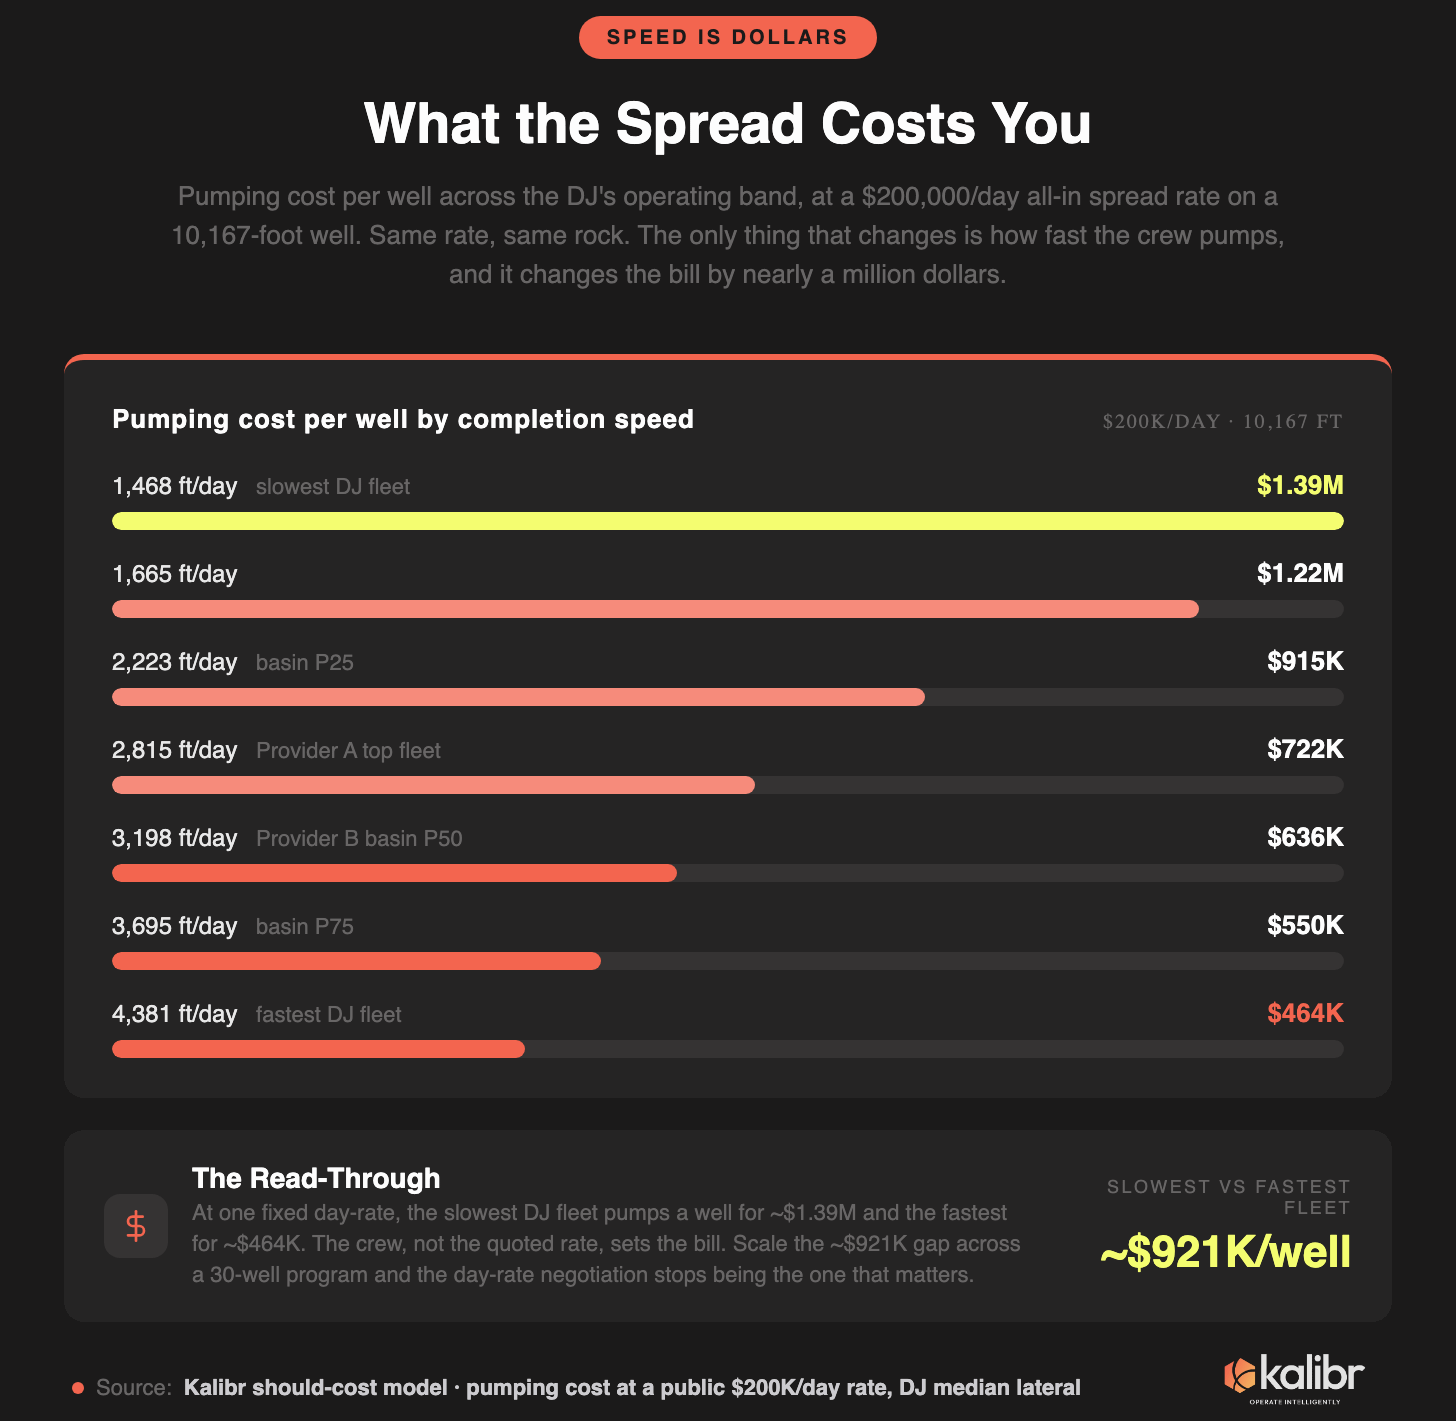
Put thirty of those wells in a program and the day-rate you negotiated so hard stops being the number that decides what the campaign costs. What decides it is the crew that pumps them, and the crew is the one input a bid sheet gives you no way to see.
What Happens When You Price the Days
The standard way to compare two frac bids is to put them in the same units. Dollars per stage, dollars per pound of sand, dollars per lateral foot: pick a denominator, divide, and the smaller number wins. Everyone is taught to do it and it is a reasonable thing to do, and it also quietly prices the rate while ignoring the days, which are the whole ballgame. A crew that finishes in three days and a crew that finishes in five can quote the identical dollar per stage. The bid sheet calls them a tie. The pad does not.
If that sounds like a technicality, the federal government disagrees, and has for decades. Federal procurement rules, the ones written so a contracting officer cannot be fooled by a low headline number, require that competing prices be adjusted for materially differing terms before anyone compares them. Completion speed is a materially differing term. It is, in fact, the term that moves the bill the most. The unit-rate method leaves it out for a dull reason: until recently there was no number to put in that column, so nobody built the column.
We have it now, at depth. Across the Lower 48 we benchmark six attributable providers on hundreds to thousands of jobs each, deep enough that the percentiles actually mean something. The speed distributions are wide, and they stay wide inside a single provider: the spread from a provider’s 25th-percentile job to its 75th runs from under 60% to nearly 120%. A single median hides most of that, and the part it hides is exactly the part you are signing for.
So you stop comparing bids and start pricing them. Take each bid, run it through the should-cost model at that bidder’s actual completion speed, and turn a headline dollar-per-stage into the only thing you actually care about, dollars per well. Do that to a real eight-bidder RFP and the ranking does not survive the trip.
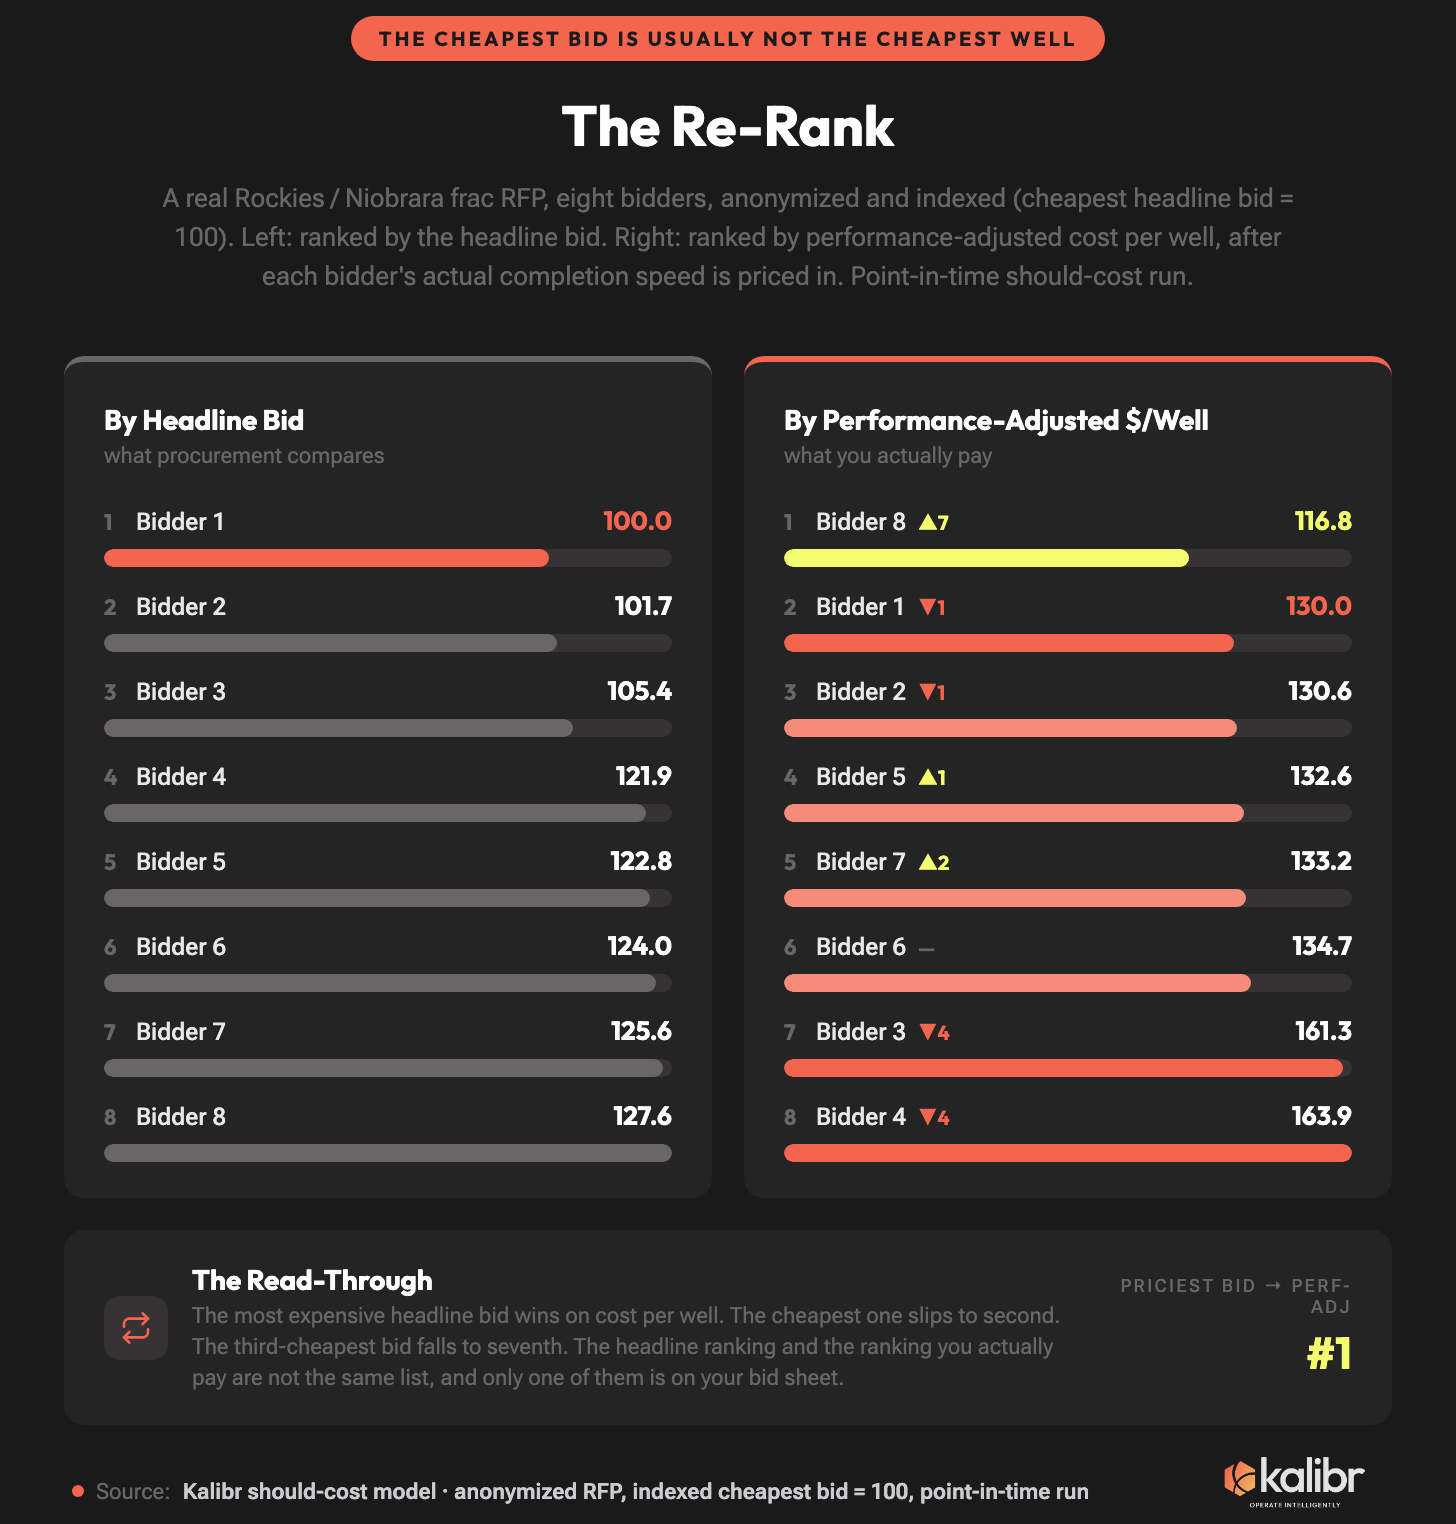
The cheapest headline bid, the one that would have won, lands second once its speed is priced in. The third-cheapest falls to seventh. The most expensive bid on the sheet, the one procurement would have thrown out first, turns out to be the cheapest well of the eight. The headline ranking and the ranking you actually pay are two different lists, and the one on your desk is the wrong one. This is a point-in-time run on one real Rockies RFP, so read the order, not the third decimal. The order is the point, and it is the same order the live basin data draws: the providers that pump fast stay fast, and the cheap-looking slow ones stay expensive.
The DJ version is cleaner, because there the gap is pure. Take our two providers, quote them the exact same day-rate, and change nothing but the speed each one actually pumps. Provider A delivers the well for $860,881. Provider B delivers it for $635,835.
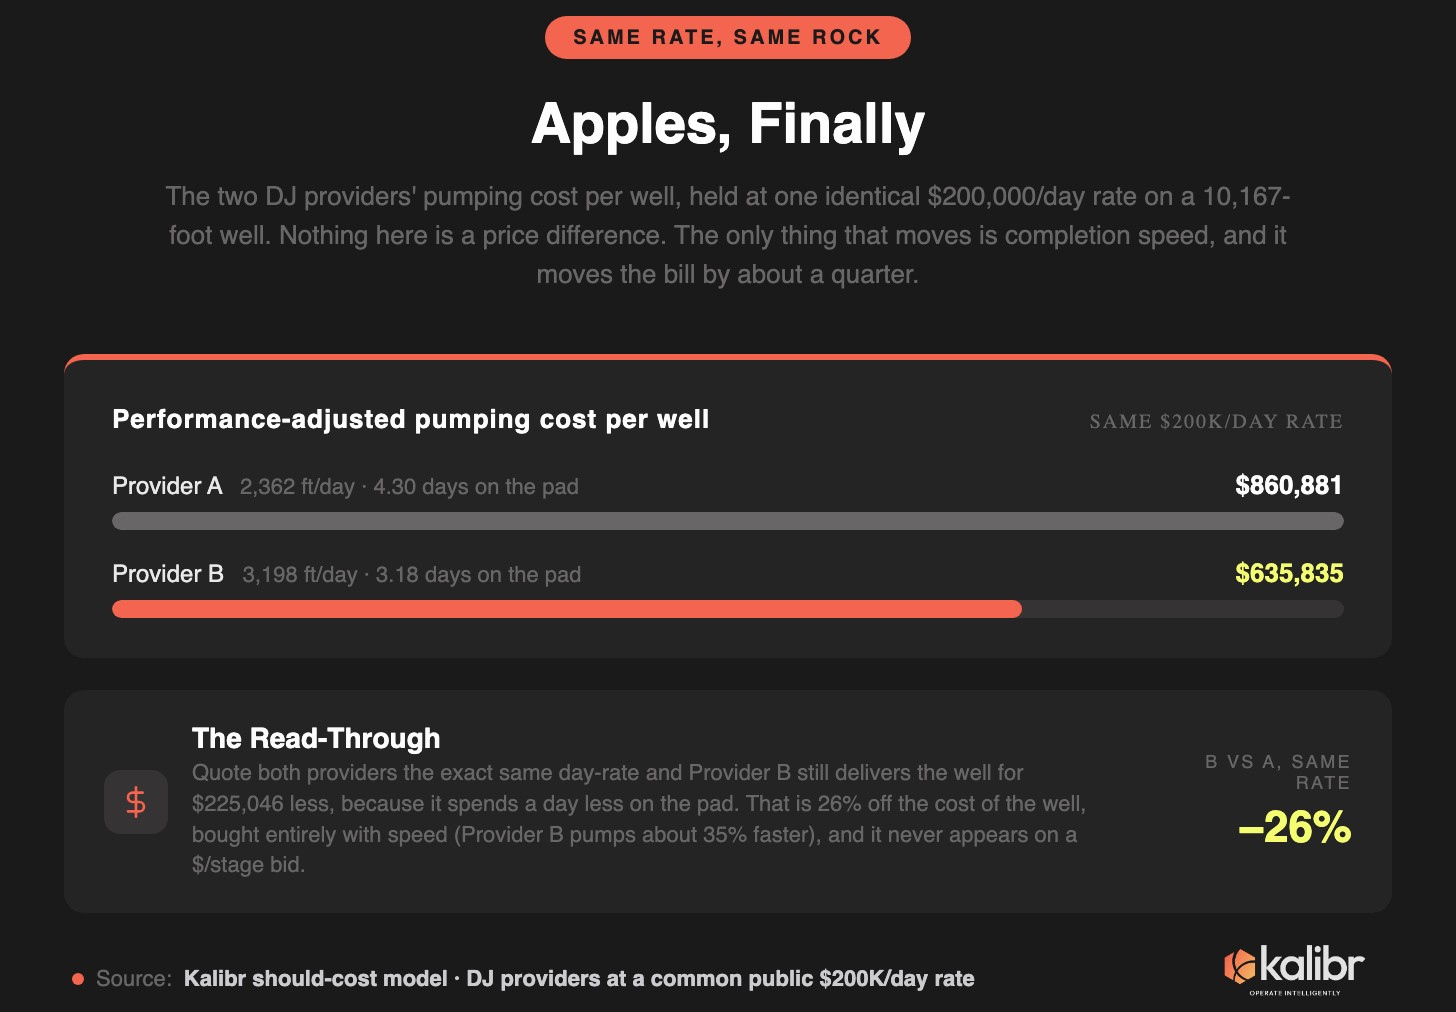
That is a quarter of a million dollars off the same well, 26% cheaper at an identical day-rate, and every dollar of it was bought with days. Provider B does exactly one thing Provider A does not: it pumps about 35% faster. That is the whole difference. A dollar-per-stage bid has nowhere to record a thing like that, so it doesn’t, and you find out on the pad.
A Cheap Bid Is a Promise Somebody Has to Keep
So far the question has been which bid is actually the cheapest. There is a second question underneath it, and it is the one that decides whether the cheap bid is even real: can the bidder do the job for the price it named, and keep doing it for the length of your program?
Break a normalized bid into what it is actually made of and most of it is two things, pumping and fuel, with not a lot else. Fuel is not a rounding error and it is not a constant. A legacy diesel spread burns something like $7,565 of energy per pumping hour; a dual-fuel fleet runs nearer $3,400; a fully electric one nearer $3,000. The drive-train under the hood moves the whole cost build-up before the crew pumps a single stage, which is why the model prices each fleet’s fuel off the iron it actually runs instead of a basin average.
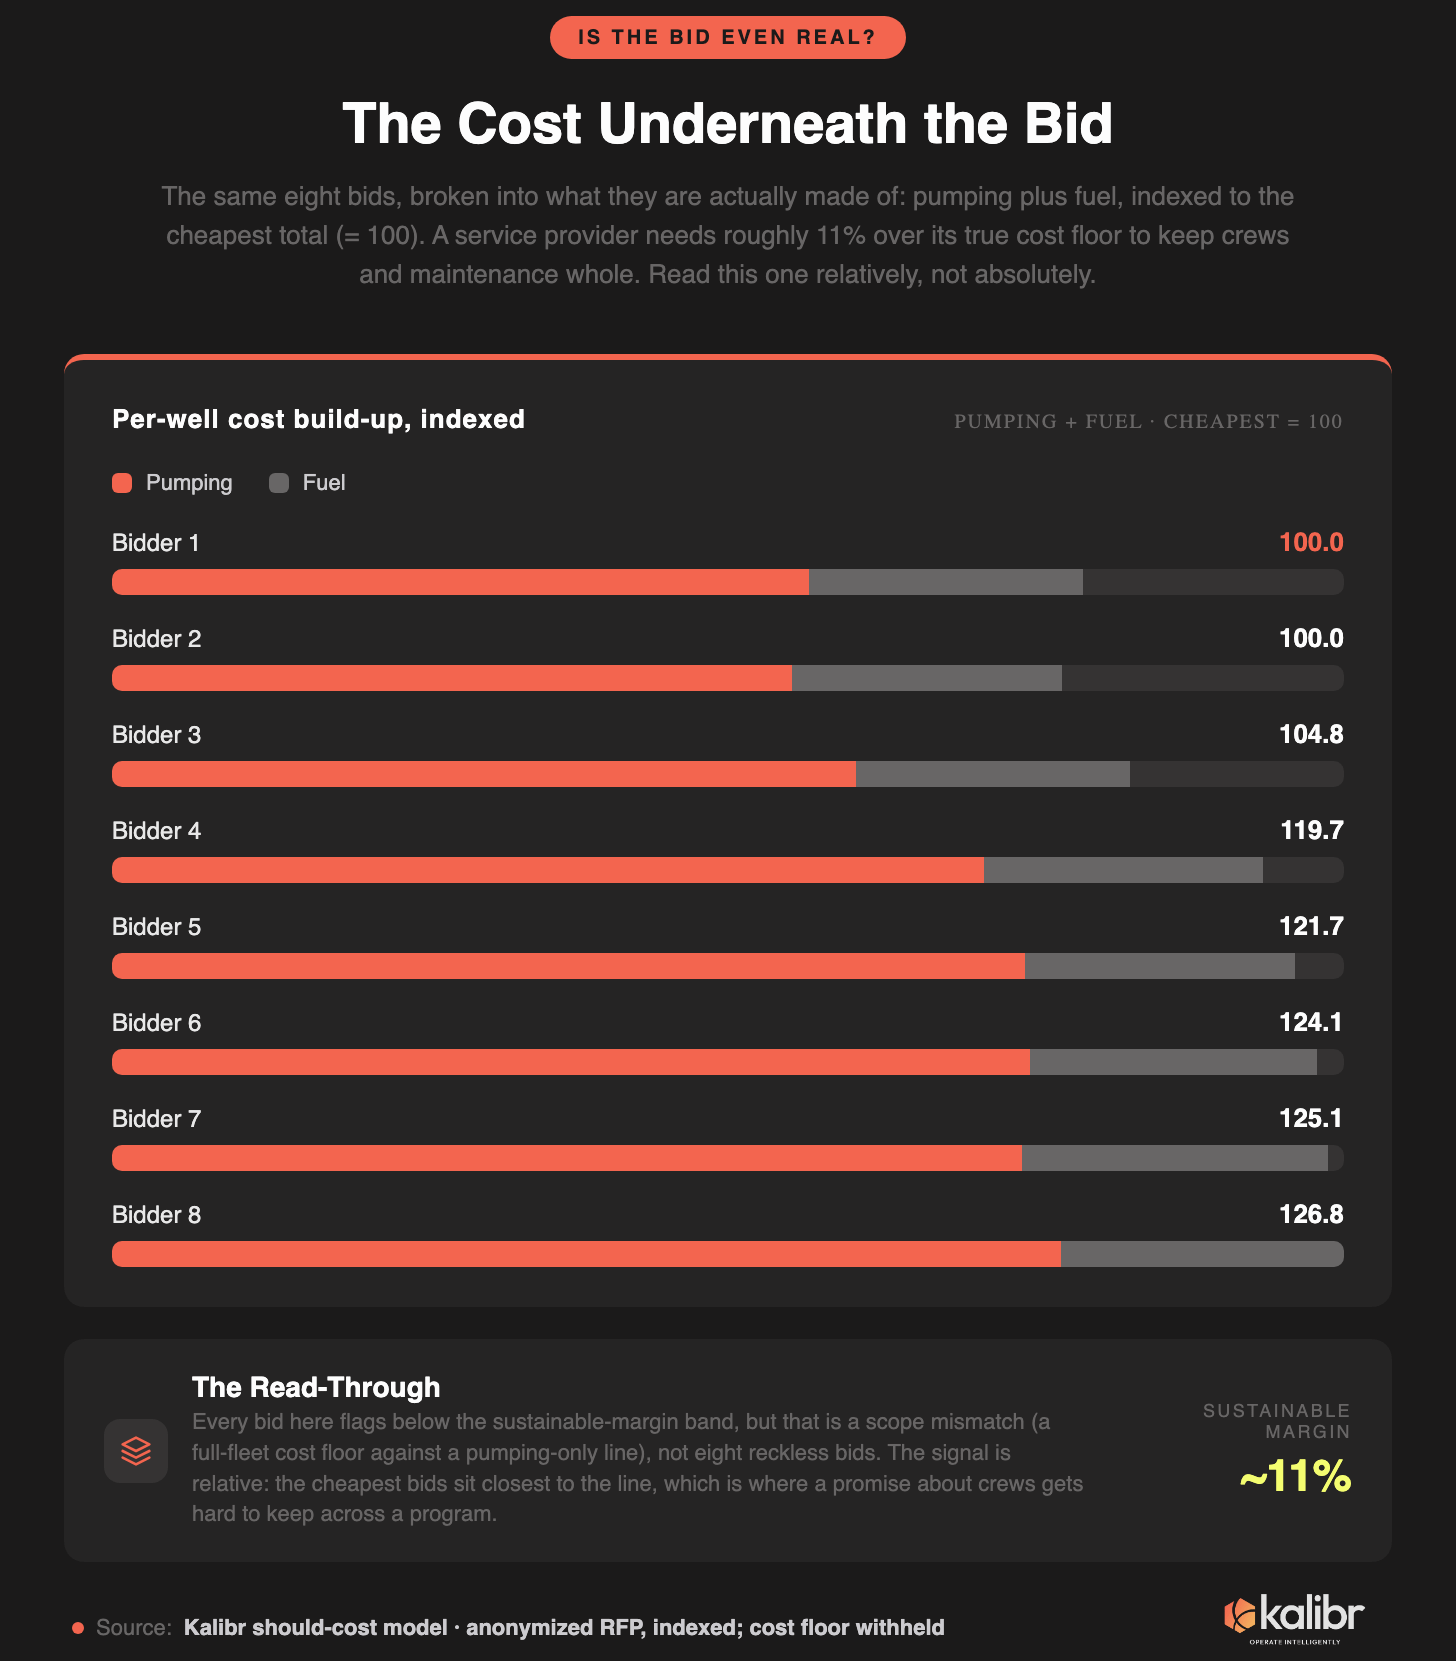
Underneath the build-up sits a floor. A service provider needs roughly 11% over its true cost to keep crews paid, iron maintained, and the next job staffed. Bid below that for long and something gives, usually in the middle of your program, which is the worst possible time for it to give. Here is the caveat, and it matters enough that hiding it would make the model useless: in this RFP, every bid flags below the sustainable band. That is not a verdict on eight reckless bidders. It is a scope mismatch, a full-fleet cost floor measured against a pumping-only line in the RFP, and the honest move is to say so rather than dress it up. The floor figure itself stays ours.
What survives the caveat is the relative read. The cheapest bids sit closest to the line, and a bid well under sustainable economics is not a discount you get to keep. It is a promise about crews and maintenance, and there are two very different stories that produce the same promise on paper. In one, the bidder runs newer, cheaper iron, genuinely pumps for less, and is handing you the savings to win the work. In the other, the bidder needs the backlog, named a number it cannot actually hold, and is quietly counting on making it back once its spread is the only one left standing on your pad. Both stories show up as the same PDF. From the bid alone I cannot tell you which one you are reading, and neither can your operating team. What tells you is whether the number clears the cost of doing the work. The timing is what makes that worth checking right now: premium fleets sold out through 2026, spot pricing moved up 10% to 30% this spring, and a number that pencils today on a thin margin is the first one to get repriced, or quietly under-crewed, the moment it can be.
A Discount Can’t Buy Back a Day
When you learn one provider is slower, the reflex is to go ask it for a discount. Reasonable. So price the reflex. Fix the faster provider at its median speed, and ask how large a day-rate discount the slower one would need to match it on cost per well.
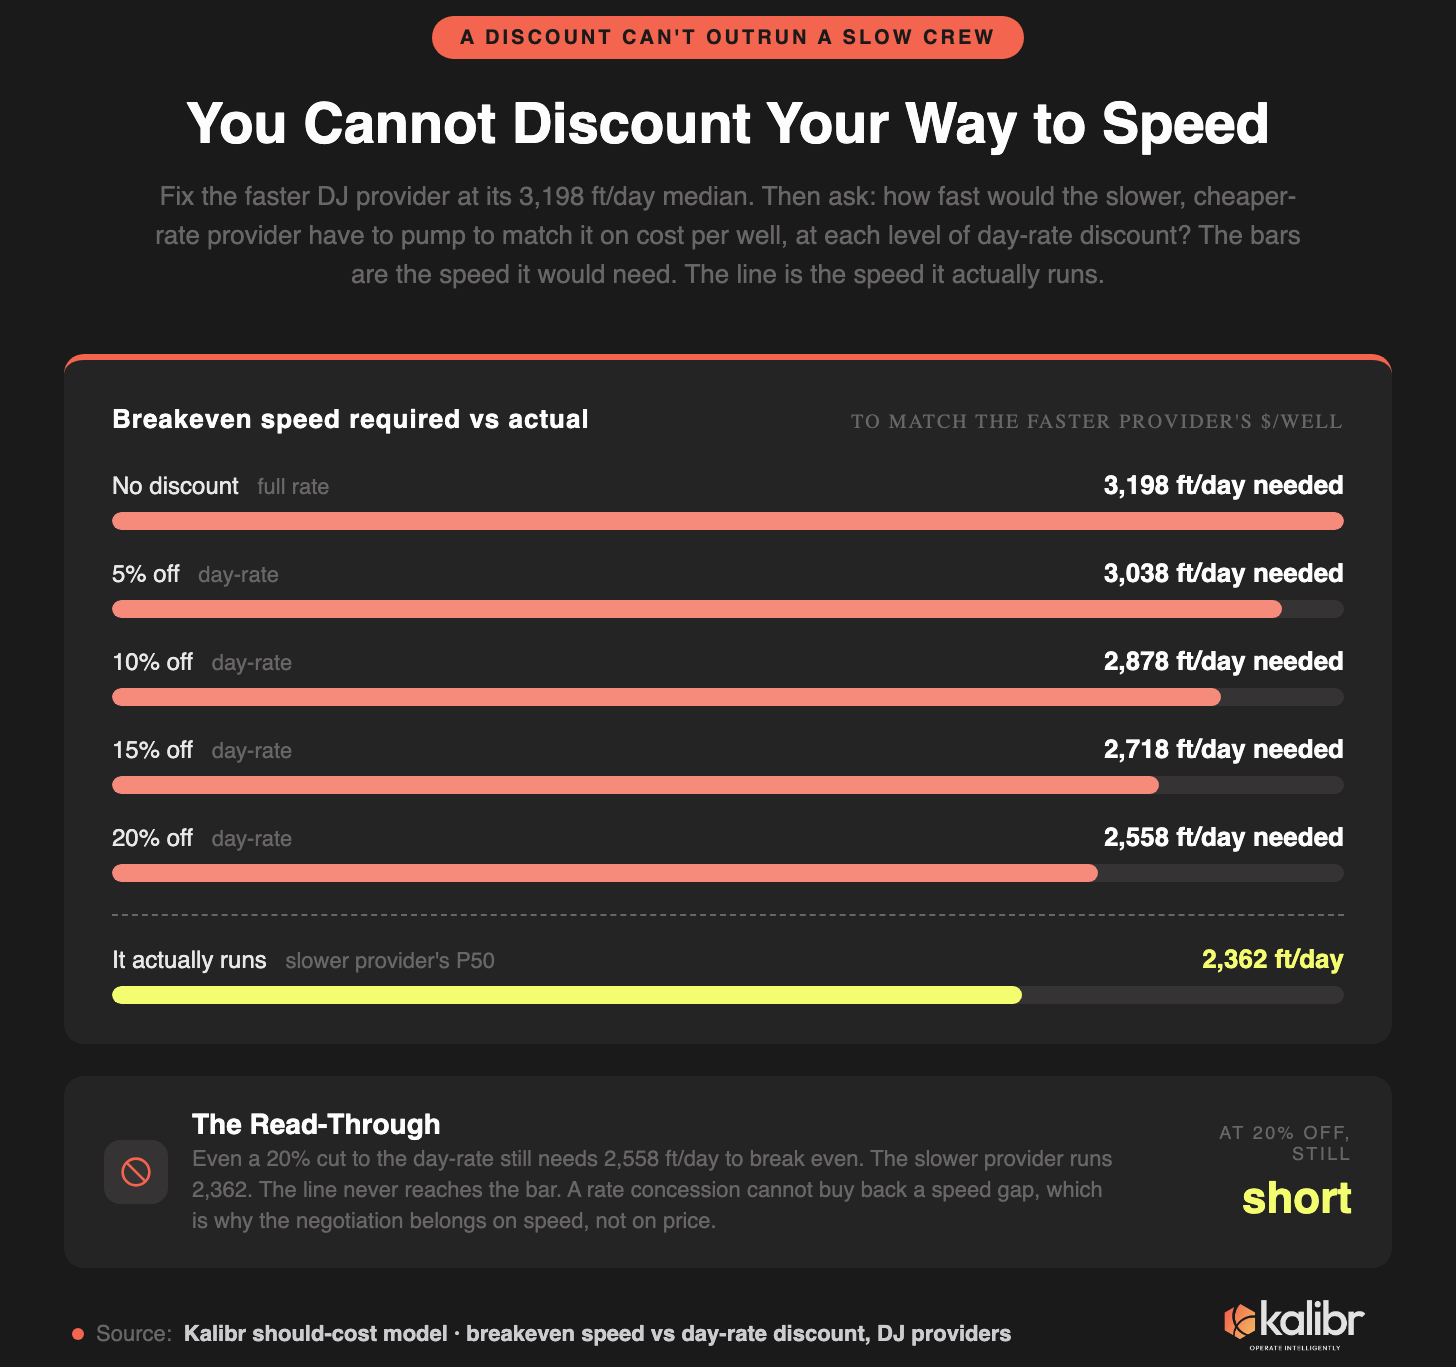
There is no such discount. At full rate the slower provider would need to pump 3,198 feet a day to match. Cut its rate 10% and it needs 2,878. Cut it a full 20%, which no one is going to give you, and it still needs 2,558. It actually runs 2,362. The line never reaches the bar. A rate concession cannot buy back a speed gap, because speed compounds against every day on the pad and a discount only touches the rate on each of them. Run it against the distribution, the 25th to 75th percentile, not a single point, so you are negotiating the range of outcomes instead of one optimistic guess.
Which is the real move once you can see the days: the negotiation slides off the rate and onto the terms that govern how many days you are buying. The sharpest of them is an out-clause that lets you stop paying full rate while the clock runs slow, which is the same arithmetic that explains why no operator will risk a wellbore to chase a nominal $3,500 a day when the spread on location is already burning two hundred thousand of it. Every lever like it is a clause about time, and time is the one thing the day-rate, argued on its own, does almost nothing to control.
What to Demand Before You Sign
The Q3 RFP is where this gets decided, so here is the short version of what completions and procurement should walk in holding. Score on performance-adjusted cost per well, not headline dollars per stage. Normalize for design before you compare crews, so the heavy program and the slow crew stop looking like the same thing. Verify completion history before you award, and put the thin-history bidders on a pilot pad before you hand them a program. Write the speed floor and the NPT out-clause into the contract, not into the kickoff meeting. Run the sustainable-margin check, so the winning number is one the provider can actually hold for a year.
The Part We Built
None of this works without the measurement, which is the thing we spent the last few years building. The first piece is a fleet-level frac performance feed: roughly 32,000 attributed pad-jobs across about a dozen basins, completion speed at the pad level, refreshed weekly off public data.
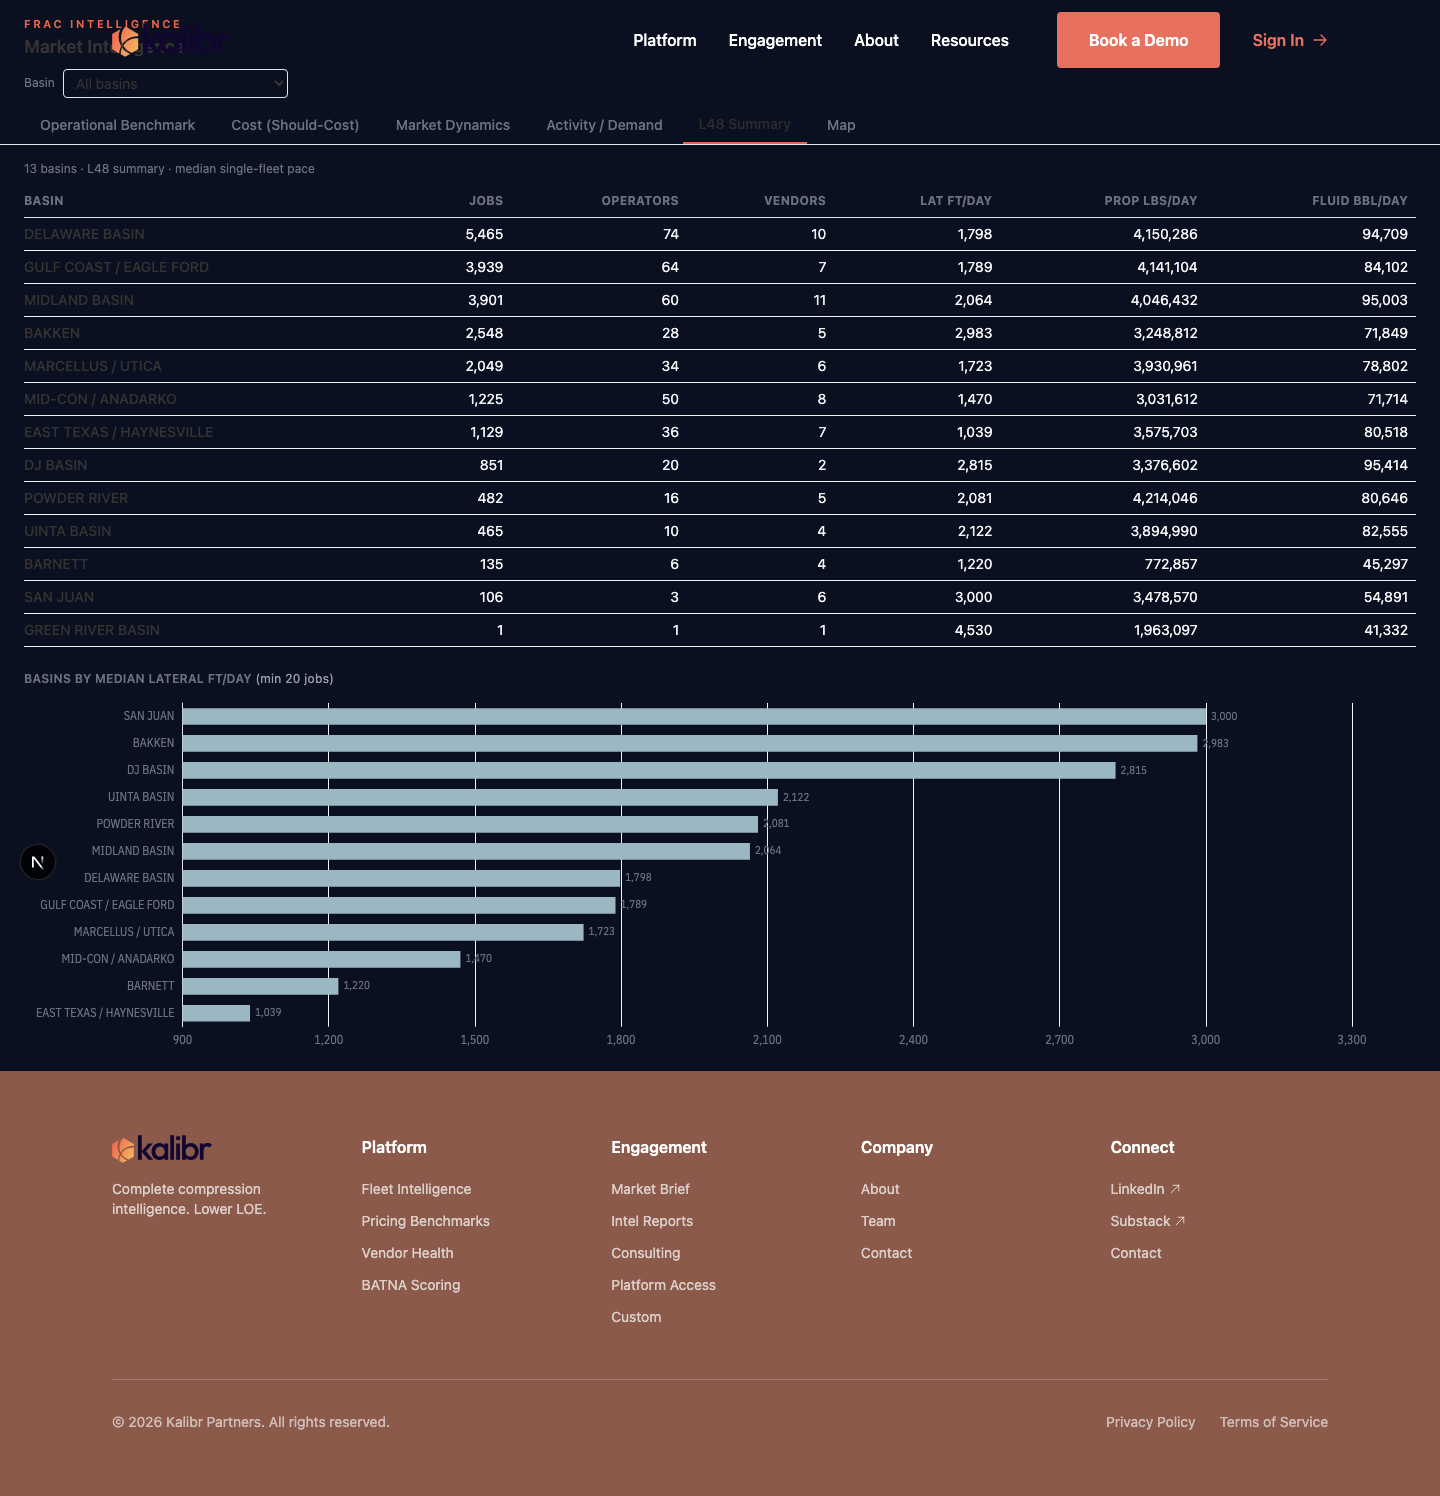
The second is a bottom-up should-cost model anchored to the financials of the one public pure-play frac company, built up from pumping, fuel by drive-train, and delivered sand priced to the basin rather than a national average. Put them together and the bid sheet stops being a list of rates and becomes a list of wells, each priced at the speed its bidder actually pumps.
Which means we can do for your RFP what we just did for the one in this piece. Hand us your bid set and your well design, and the model turns each bidder’s rate into a cost per well at the speed that bidder actually pumps, adjusted for your basin’s sand and fluid instead of a national average, and hands you the performance-adjusted re-rank before you sign anything, while the order can still change the award. It is not a one-off memo. It is the same live feed and model this piece runs on, pointed at your bids. If you are running a frac RFP this quarter, the most useful thirty minutes you will spend on it are the ones you spend looking at your own bids re-ranked.
You are not buying stages. You are renting days, at a rate you negotiate and a speed you do not. The bid quotes the rate to the dollar and says nothing about the speed, and the speed is the only variable that decides what the well costs. That was tolerable while the days had no number and everyone was equally blind to them. They have a number now, which means the next RFP you run is the first one where not looking is a choice.
Until next time. Stay hedged.