

Nominally Hedged | 3.6.2026: The OCTG Market Changed. Your Contracting Playbook Didn't.
What the tariff reset, a lagging index, and the wrong demand model are costing E&P operations groups right now.

Widget Diplomacy
Let’s say a foreign company makes widgets (Yes, I love widget examples). Congress says that’s a national emergency. Three agencies get to work.
Tool one: the antidumping duty. The Commerce Department figures out what the widget should cost in the foreign producer’s home market, then turns that theoretical cost advantage into a tariff rate. Some came in above 100%. Others at 44.93%. Others at 78.30%. These numbers imply very careful math. Whether they correspond to anything observable in the real world is a question the lawyers prefer not to examine, because the lawyers get paid either way. The widget does not have an opinion.
Tool two: the countervailing duty. Same idea, different offense; not “you’re selling too cheap” but “your government is helping you sell too cheap.” Stacked directly on top of the first rate. Two agencies. Two rate-setting processes. Two sets of lawyers in no hurry.
Tool three: Section 232. Different game entirely. The first two tools are about fairness. This one is about national security. A blanket 25% tariff, no dumping finding required, no subsidy calculation necessary. Security matter, done. The widget is now a geopolitical actor.
All three stack. The widget isn’t just expensive. It’s expensive in three directions at once, for three official reasons, administered by three agencies who have never been in the same room and have no intention of changing that.
Then the exceptions. Bilateral carve-outs, hard quotas, tariff-rate agreements; each country negotiating its own arrangement, each deal its own legal instrument, each instrument its own lawyers. One producer negotiated an import allowance calibrated to an exact ton (not a round number, an exact figure) in a document justified by national security. The widget, at this point, probably has its own trade attorney and a LinkedIn post highlighting “The 10 things I learned about B2B sales through tariffs.”
By the mid-2020s, the machine had issued so many bespoke exceptions that it had stopped sorting anything. Then the reset. Every exemption revoked. Blanket tariffs reinstated and doubled. Years of learned behavior, erased overnight.
The widget doesn’t care what you call it. It does care that it is OCTG, and it goes in the ground.
One Market, Then Two
A stacked tariff doesn’t hurt all pipe equally. It hits premium and commodity grades asymmetrically, and that asymmetry, without a single phone call or industry meeting, sorted an entire market.
At the premium end, the purchase decision was never just about price. There’s a specification, a qualification process, a technical relationship, institutional knowledge built over years. A foreign producer competing here isn’t fighting the tariff alone. They’re fighting the tariff plus the qualification barrier plus the certification cycle plus the accumulated weight of every prior purchase decision. Domestic producers looked at this and made a rational choice: this is where we live. The tariff didn’t just protect premium, it calcified it. Producers with strong balance sheets, domestic manufacturing, and proprietary connections were going to win this segment regardless. The tariff just meant winning it required less effort, at higher margins, against a field that had been administratively thinned.
The commodity end is a spreadsheet. No proprietary spec. No qualification cycle. Just: what does it cost delivered. The tariff bites here too (50% is still 50%) but a foreign producer with structurally lower input costs can absorb enough to stay competitive. Domestic producers ran the same calculation in reverse: why fight a cost-per-unit battle against someone with lower labor and energy costs when the premium end is sitting there uncontested?
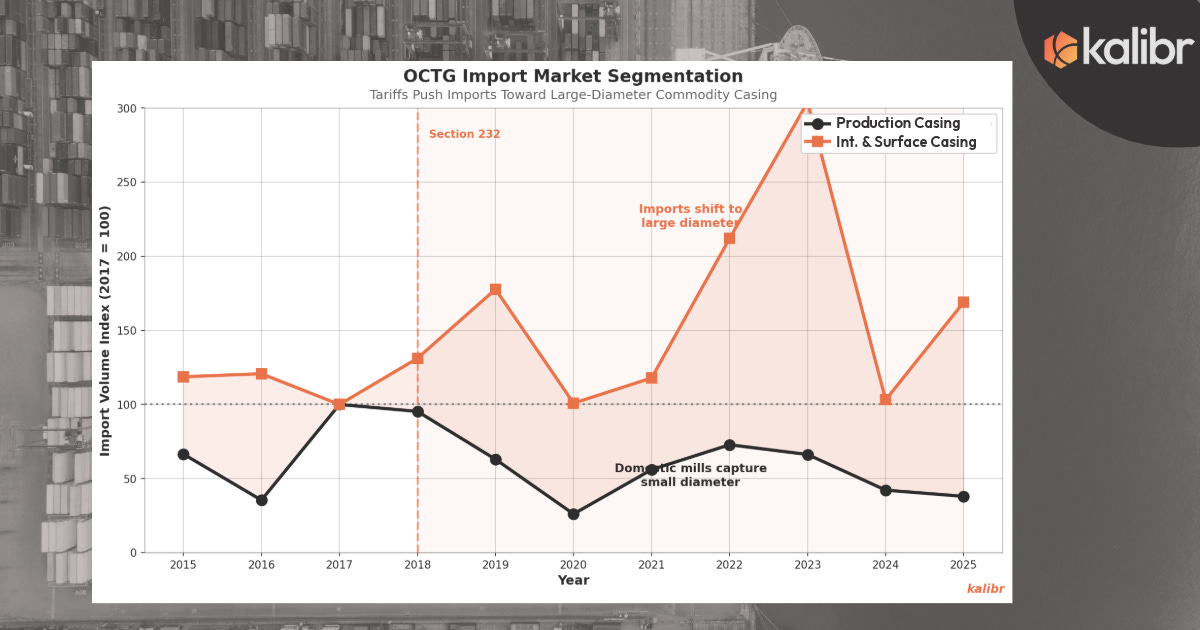
Nobody coordinated this. Everyone read the same signal, the tariff gradient, permanent and public, and independently arrived at the same answer. Domestic producers migrated up. Foreign producers concentrated down. One market became two. The government spent fifteen years building a machine to protect domestic producers and accidentally built the market structure that a McKinsey team would charge seven figures to recommend.
McKinsey would call it strategic portfolio optimization. The game theorists would call it a coordination equilibrium sustained by a common focal point. The lawyers would call it Tuesday.
The operations group that needs to catch up is on the buy side, because the old mental model, domestic and import mills competing across the full product spectrum, price tension everywhere, a credible alternative always one call away, is simply no longer accurate. The segmentation is real, structural, and built on a tariff schedule that is not going away. Most operations playbooks were written for the market that existed before it was reorganized.
You Brought a Weathervane
When operations groups use data to make OCTG decisions, it tends to come from two places. Neither was designed for the market that currently exists.
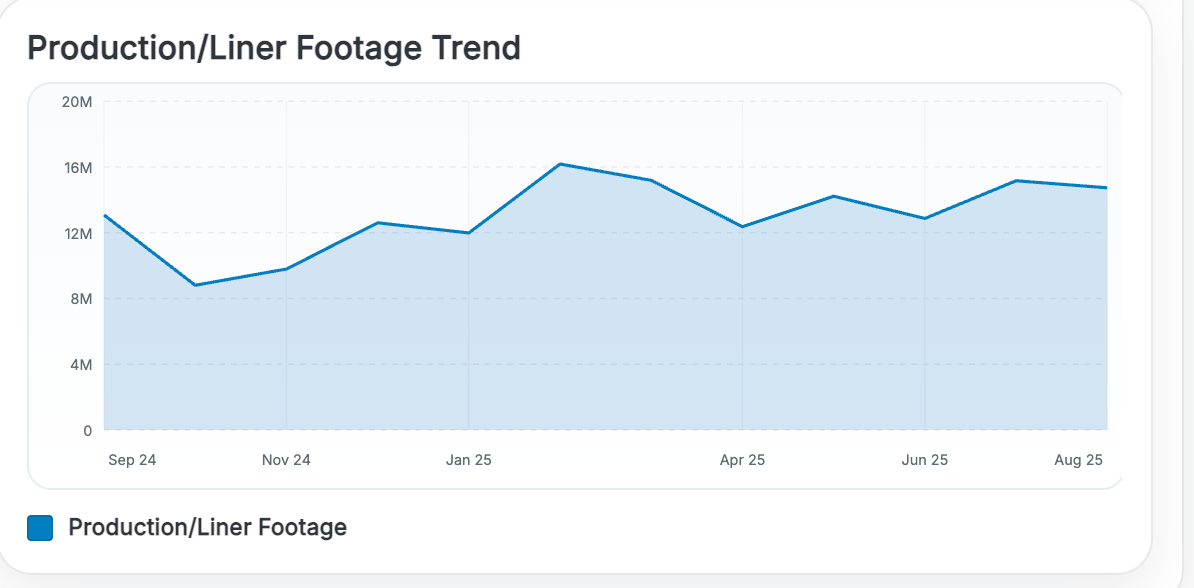
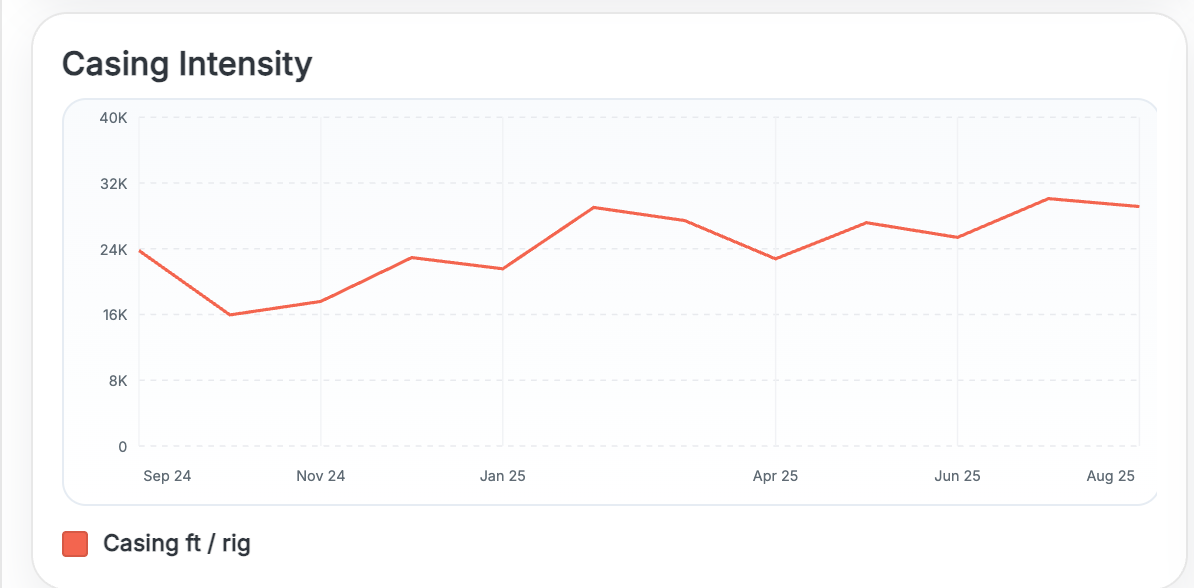
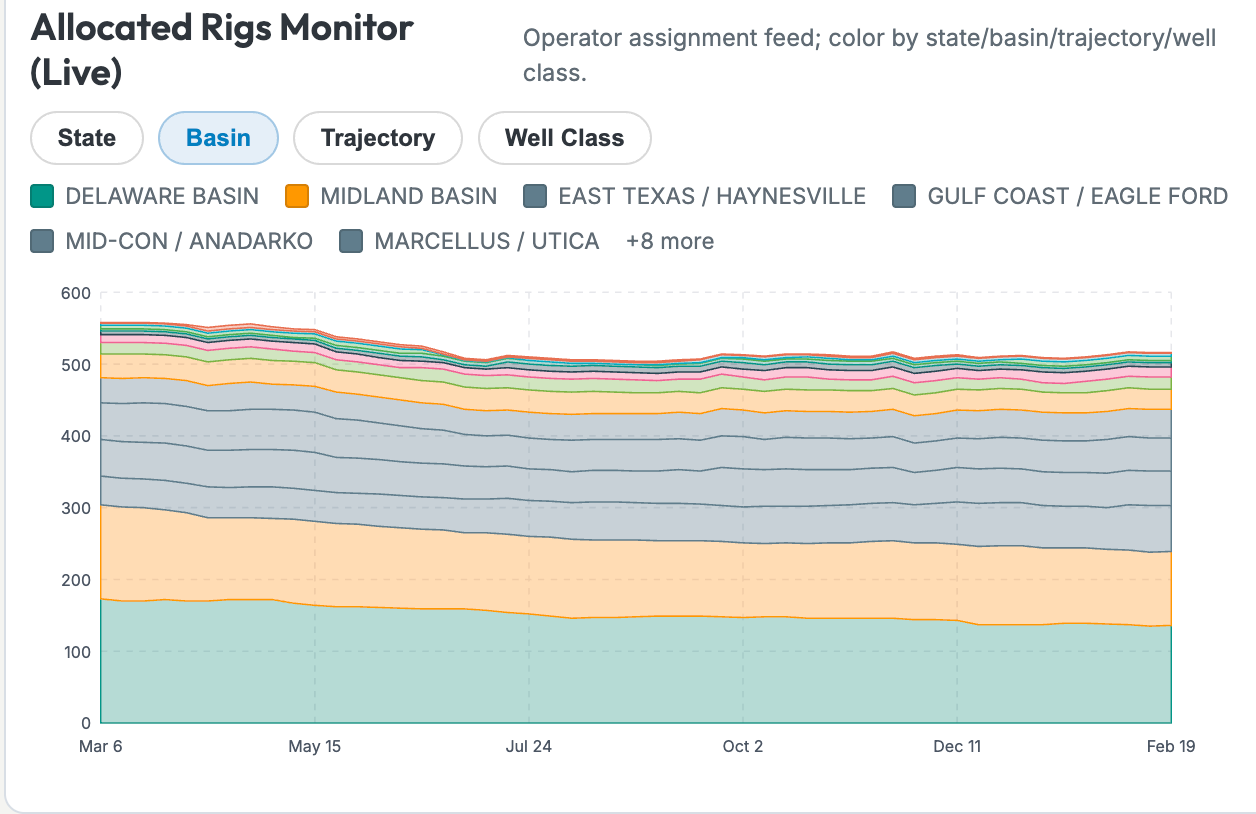
The rig count model. The industry default demand framework, and it was reasonable when it was built. Rig count as a demand proxy fails to capture drilling efficiency gains — fewer rigs are drilling more footage than three years ago, which means rig count systematically understates demand intensity as that trend continues. It cannot account for lateral length inflation, which changes not just the volume of OCTG demanded but the specific product mix. And it has no mechanism for the bifurcated operator environment you’re actually in right now, where a well-capitalized major on a board-approved program and a leverage-constrained PE-backed private respond to the same WTI print with completely different drilling behavior.
A model that cannot distinguish those two cases is not a demand forecast. It is an activity count. It tells you how many rigs are running. It does not tell you what they are buying, from whom, or at what point in the product stack the pressure is actually building.
Pipe Logix. This one deserves careful treatment, because it is widely cited and widely misunderstood — a combination that tends to be expensive for whoever is on the wrong side of it.
Pipe Logix is a distributor sentiment survey. A diffusion index constructed from voluntary responses by a panel of distributors on questions about order books, inventory, and price expectations. The benchmark pricing data is a legitimate spot market reference. The problem is not the index itself. The problem is what happens when you build a term contract around it.
The whole logic of committing volume to a mill is straightforward: you trade flexibility for price certainty, the mill trades margin for utilization predictability, both sides capture something real. That trade only works if the price you lock in actually reflects the market at the time you commit. Pipe Logix indexing quietly voids that logic. Changes take one to two quarters to flow through into contract pricing — Tenaris management confirmed this publicly regarding their own North American contract reset cadence. The index declined four consecutive months through December 2025. An operations group on an indexing agreement in that environment continues paying near-peak rates for six months after the physical market has already corrected.
What that means structurally: you have surrendered the volume commitment, which is real and binding, in exchange for price certainty, which the indexing lag has made illusory. You have locked in the obligation without locking in the benefit. At that point a spot buyer, no commitment, full flexibility, is actually better positioned to capture the market as it moves. The index doesn’t make term contracts bad. It makes indexed term contracts a mechanism for giving up optionality without getting paid for it.
There are two additional construction issues worth noting, though neither is the primary concern. Survey respondents report prices with an inherent incentive to cluster near prior month levels — sharp declines devalue their own inventory — so with distributor sentiment at lows and roughly three months of supply in the market, the index likely overstates true clearing prices. And the seamless segment has actively decoupled from Pipe Logix when the market falls while using it as a floor when the market rises, a dynamic JP Morgan has specifically noted in Tenaris pricing commentary. Both are real. But the more fundamental issue is the one above: the indexing lag structurally inverts the trade you thought you were making.
Pipe Logix is a weathervane. It tells you which way the wind is blowing after it has already arrived. A weathervane is the right tool until the weather system changes. When it does, you need a forecast.
The Number Under The Number
The right starting point is not what an index says. It is what it actually costs to make steel tube and put a connection on the end of it. This is harder than it sounds, and the difficulty is not accidental, cost opacity is a competitive advantage for the people selling you pipe.
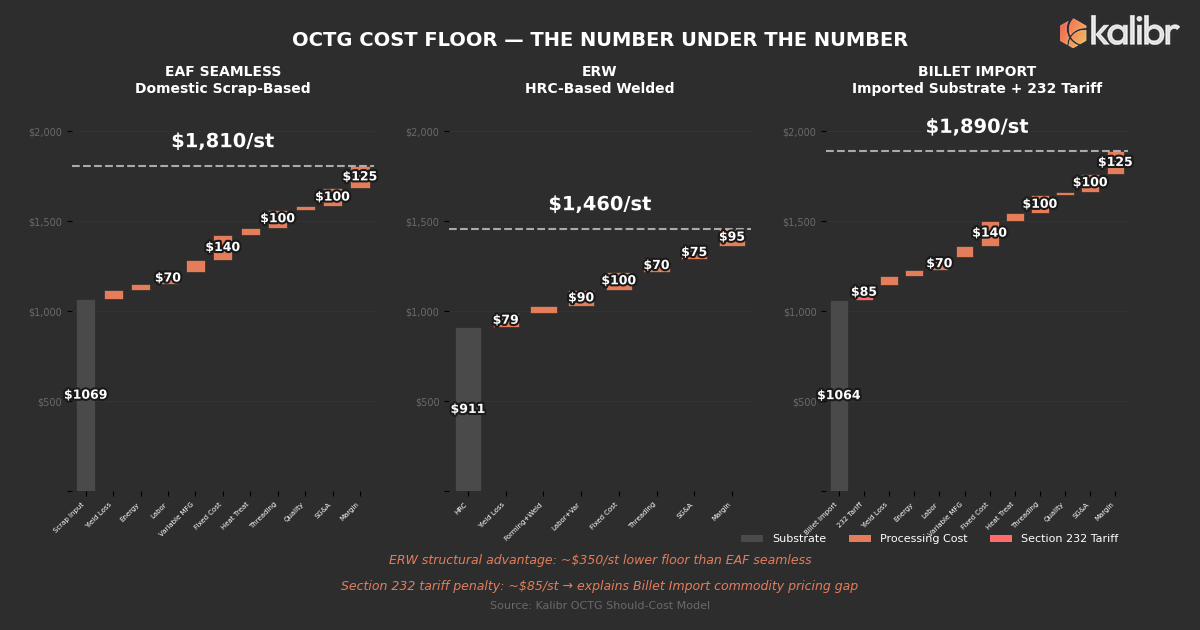
The domestic OCTG market runs on two fundamentally different steelmaking processes with completely different cost structures.
The EAF mill melts recycled scrap using electricity. Primary input costs are two variables: scrap and power. Both are volatile. Both trade on liquid futures that encode the market’s real-time view of where input costs are heading — which means a disciplined analyst can build an EAF cost floor from public data alone, updated monthly, without a single conversation with the mill. The yield dynamics of the seamless piercing process introduce a cost multiplier that most surface-level analyses get wrong, and getting it wrong compounds into meaningful floor estimation error.
The ERW mill starts with hot-rolled coil, forms it into a cylinder, and welds the seam. Better yield. Lower energy intensity. Lower capital requirement. Structurally lower cost floor. ERW and seamless are not the same product competing on the same cost basis. A procurement strategy that treats them as interchangeable is leaving money on the table before the conversation starts.
Then there is the third archetype that most cost analyses miss entirely: the billet importer.
Some domestic mills do not produce their own substrate. They import semi-finished steel, billets or green tubes, and run them through downstream operations domestically. The finished product is technically domestic pipe. The substrate carries the full Section 232 tariff on the way in.
At a 50% Section 232 rate, imported billet adds a meaningful per-ton penalty relative to a domestic EAF competitor sourcing scrap at market. The producer who built their U.S. manufacturing footprint around imported substrate is paying the tariff that was ostensibly designed to protect them. The wall keeps out the competition and simultaneously taxes the raw material. This is the kind of outcome that makes trade lawyers wealthy and procurement analysts confused.
The practical consequence for a buyer: the billet-import producer has extraordinary competitive strength in the premium segment — proprietary connections, rig-direct distribution, deep operator relationships — and a structurally challenged cost position on commodity grades. They are not trying to win commodity casing. Their cost structure is one of several reasons why. Which changes the bundling conversation considerably.
A few layers that matter on top of raw substrate:
P110 heat treatment. Quench and tempering adds meaningfully to the cost structure.
Threading and connections. This is where the cost stack becomes a hierarchy. Fully integrated seamless with proprietary in-house connection technology and rig-direct distribution captures the highest revenue per ton and carries the deepest moat. The connection is not just a product — it is a switching cost embedded in every well program you run. Understanding that is the first step toward negotiating it correctly.
Freight. Systematically underweighted. Mills were sited deliberately for their basins. A Haynesville ERW mill sitting inside the basin has already won on freight to Haynesville before your RFQ goes out. Procurement strategy that ignores geography is fighting a structural advantage instead of using it.
The one variable that is not directly observable — and the one that matters most when the market is turning — is utilization. Fixed cost absorption moves materially with utilization, and it is the variable mills have the most incentive to obscure in public commentary. The difference between a mill at 70% and 90% utilization represents meaningfully different cost floors, and that difference determines whether current market prices represent a floor or a ceiling with room to fall.
There are observable signals that triangulate utilization without requiring the mill to disclose it. Mapping those signals changes the procurement conversation from what does the index say to how close is the market price to the point where this specific producer starts curtailing. Those are different questions. The second one is the right one.
What The Mill Thinks Of You
The supply-side cost floor tells you the bottom. It does not tell you when the market gets there, how long it stays, or what your specific buying power looks like relative to everyone else competing for the same pipe.
The conventional demand model asks: how much pipe does the market need? That is a reasonable question and also an incomplete one. The market is not a single buyer. It is approximately 650 operators across fourteen basins with different capital structures, different board mandates, different hedging books, and fundamentally different propensities to drill when WTI prints the same number.
A model that starts with aggregate rig count cannot distinguish a well-capitalized major on a board-approved five-year program from a leverage-constrained PE-backed private on a borrowing base renewal. Those two operators respond to the same commodity price signal with completely different behavior. Conflating them is how aggregate forecasts systematically overstate demand at the tails and miss inflections at the turns.
The insight that most operations groups have never formalized: your position on the demand curve is not just a function of how much pipe you buy. It is a function of how reliably you buy it, how predictably you can commit to future volumes, and how that reliability compares to every other buyer the mill is evaluating simultaneously.
A large operator with variable drilling behavior is less valuable to a mill than a smaller operator with a credible multi-year commitment — because the mill is not just selling pipe, it is managing utilization, and utilization predictability has real economic value that shows up in pricing. The operator who understands this can negotiate it. The one who doesn’t pays the price of being treated like a spot buyer even when they’re not.
Where you sit on the volume-conviction surface determines not just what discount you should be able to negotiate, but which mills have the most incentive to compete for your business, at what point in their fiscal calendar, and under what contract structure. Most operators have never mapped where they actually sit. The ones who have are having different conversations with their vendors.
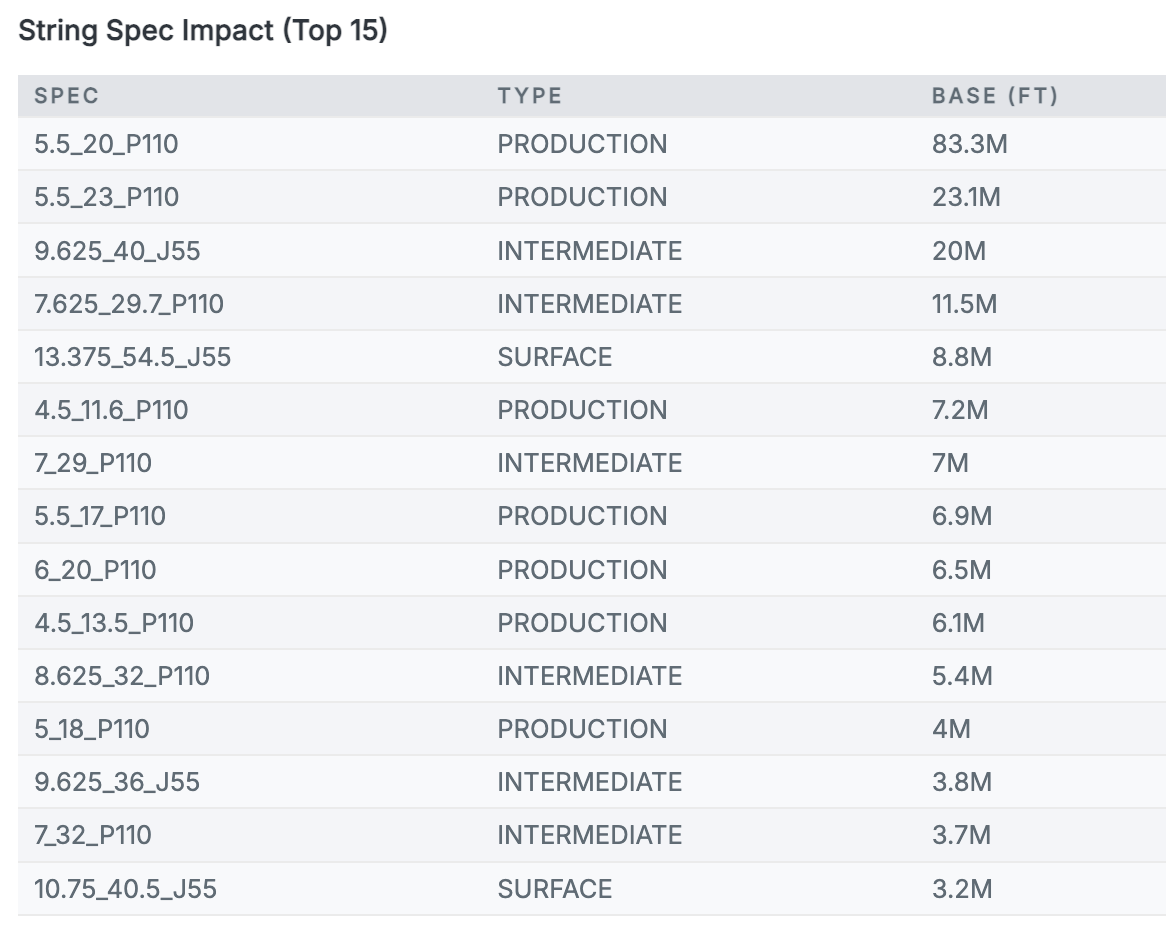
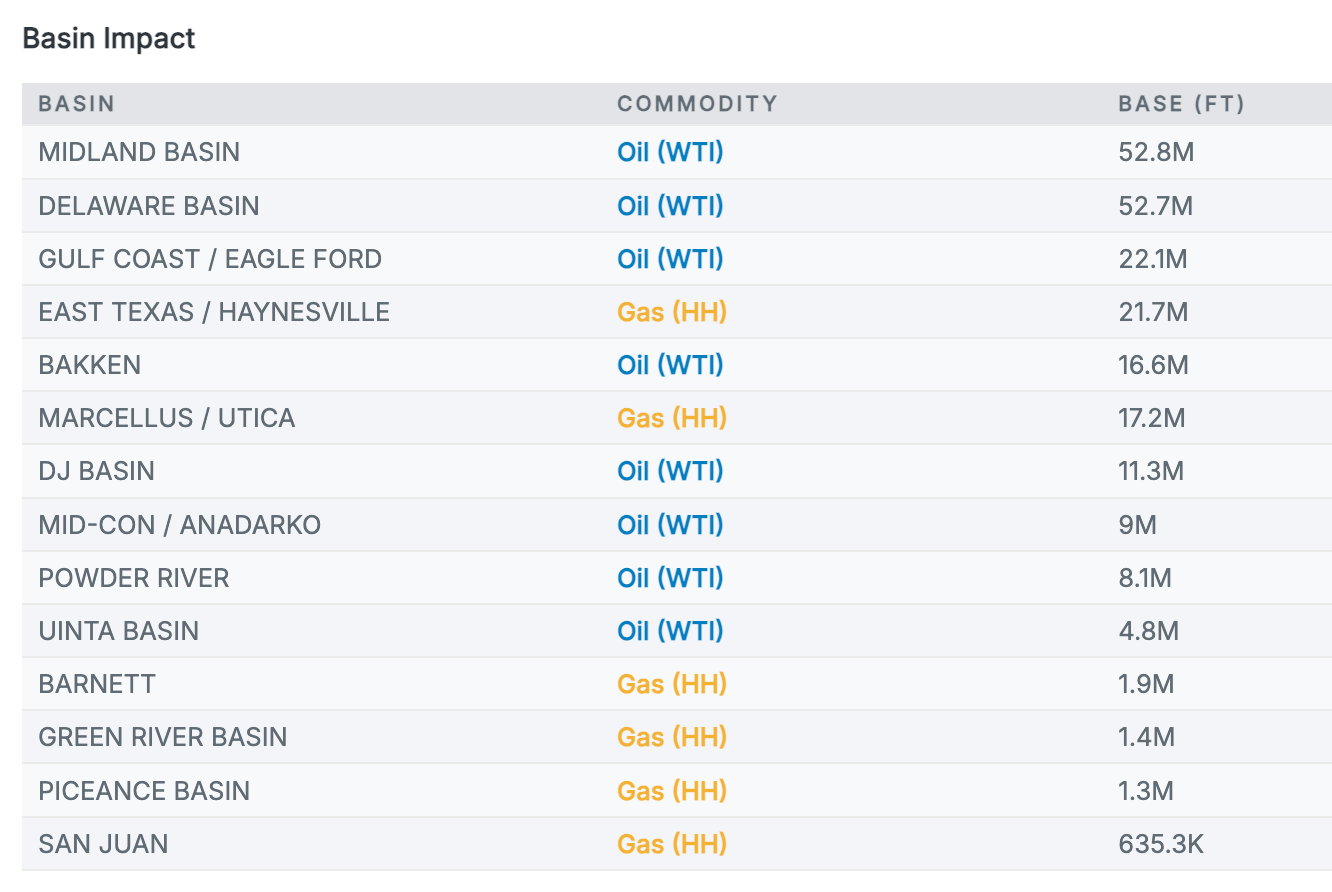
The Midland and Delaware Basins together account for the dominant share of 5.5” P110 production casing demand. The top two specs represent a disproportionate share of total footage demand — both concentrated by basin, with bear-to-bull sensitivity in the 10–13% range. That figure is the model’s answer to a question most operations groups haven’t asked: how much does my buying environment change between a $57 WTI world and a $72 WTI world? The answer, at the spec level, is more than most contracting postures have priced in.
Distributor inventory is elevated. Working capital pressure is visible in publicly disclosed financial metrics for anyone paying attention. The difference between an operations group that understands the distributor’s financial position and one that doesn’t runs $100–200 per ton on identical pipe. That gap is not permanent — it closes as the supply overhang works off. The cost model tells you where the floor is. The demand model tells you when the window closes.
Together they answer the one question operations groups actually need answered: lock in now, or wait?
Timing Isn’t Neutral
The rig count model and the Pipe Logix index were fit for purpose when the market they were built to describe actually existed. The market reorganized. Nobody updated the instruments.
The operations group that has mapped its own position on the demand curve, built its own cost floor, and walked into a renewal knowing what the mill’s utilization-adjusted breakeven looks like — that group is having a negotiation. Everyone else is having a pricing conversation where only one side brought data.
The lock-in window is open. How long it stays open is a function of inputs the rig count cannot see. When it closes, it will close faster than the index confirms it.
Ignorance is not neutral. It is a pricing signal the market reads every time you sign a renewal.
This is the first in a series. The framework above is the foundation; supply-side cost architecture, demand conviction, and the analytical connective tissue that actually answers a contracting question. The interesting part starts now.
A few of what we’ll work through in the coming weeks:
What actually happens to demand when two major operators consolidate? The press release says “synergies.” The demand model says something more specific: which specs compress, in which basins, on which timeline, and what that means for the mills who had both operators as customers and now have one.
If Pipe Logix is a structurally compromised indexing mechanism (and we’ve made the case that it is) what does a better one look like? There are observable market inputs that encode real clearing price information without the survey bias, the inventory incentive distortion, or the one-to-two quarter lag. We’ll build one.
What happens to 4.5” P110 demand concentration when a major Bakken operator pauses its drilling program? The spec is already highly concentrated by basin. A single operator decision can move the supply-demand balance materially — and the pricing response may arrive before most buyers realize the shift has happened.
These aren’t hypotheticals. They’re the questions that fall out naturally when the model is granular enough to ask them. The rig count can’t answer any of them.
Same time next week. Bring your AFE.