

Nominally Hedged | 1.14.2026: What Jet Engines and Oxygen Plants Can Teach You About Compression
When industries with 70 percent supplier margins finally push back, they don’t reinvent the wheel. They borrow it.

Last week we established the conveyor belt problem. Compression providers earn roughly 70 percent gross margins on equipment that governs whether your wells produce or stumble. You outsourced a factory component that cannot be swapped without redesigning the factory. The obvious question followed: what now?
The less obvious answer is that you are not the first industry to confront this. Airlines and steel manufacturers have been navigating nearly identical dynamics for decades. Their playbooks are worth studying, not because compression is exactly like jet engines, but because the structural economics rhyme in ways that should make operators uncomfortable.
Let us start with aviation.
Power by the Hour: The Original Outsourced Uptime Model
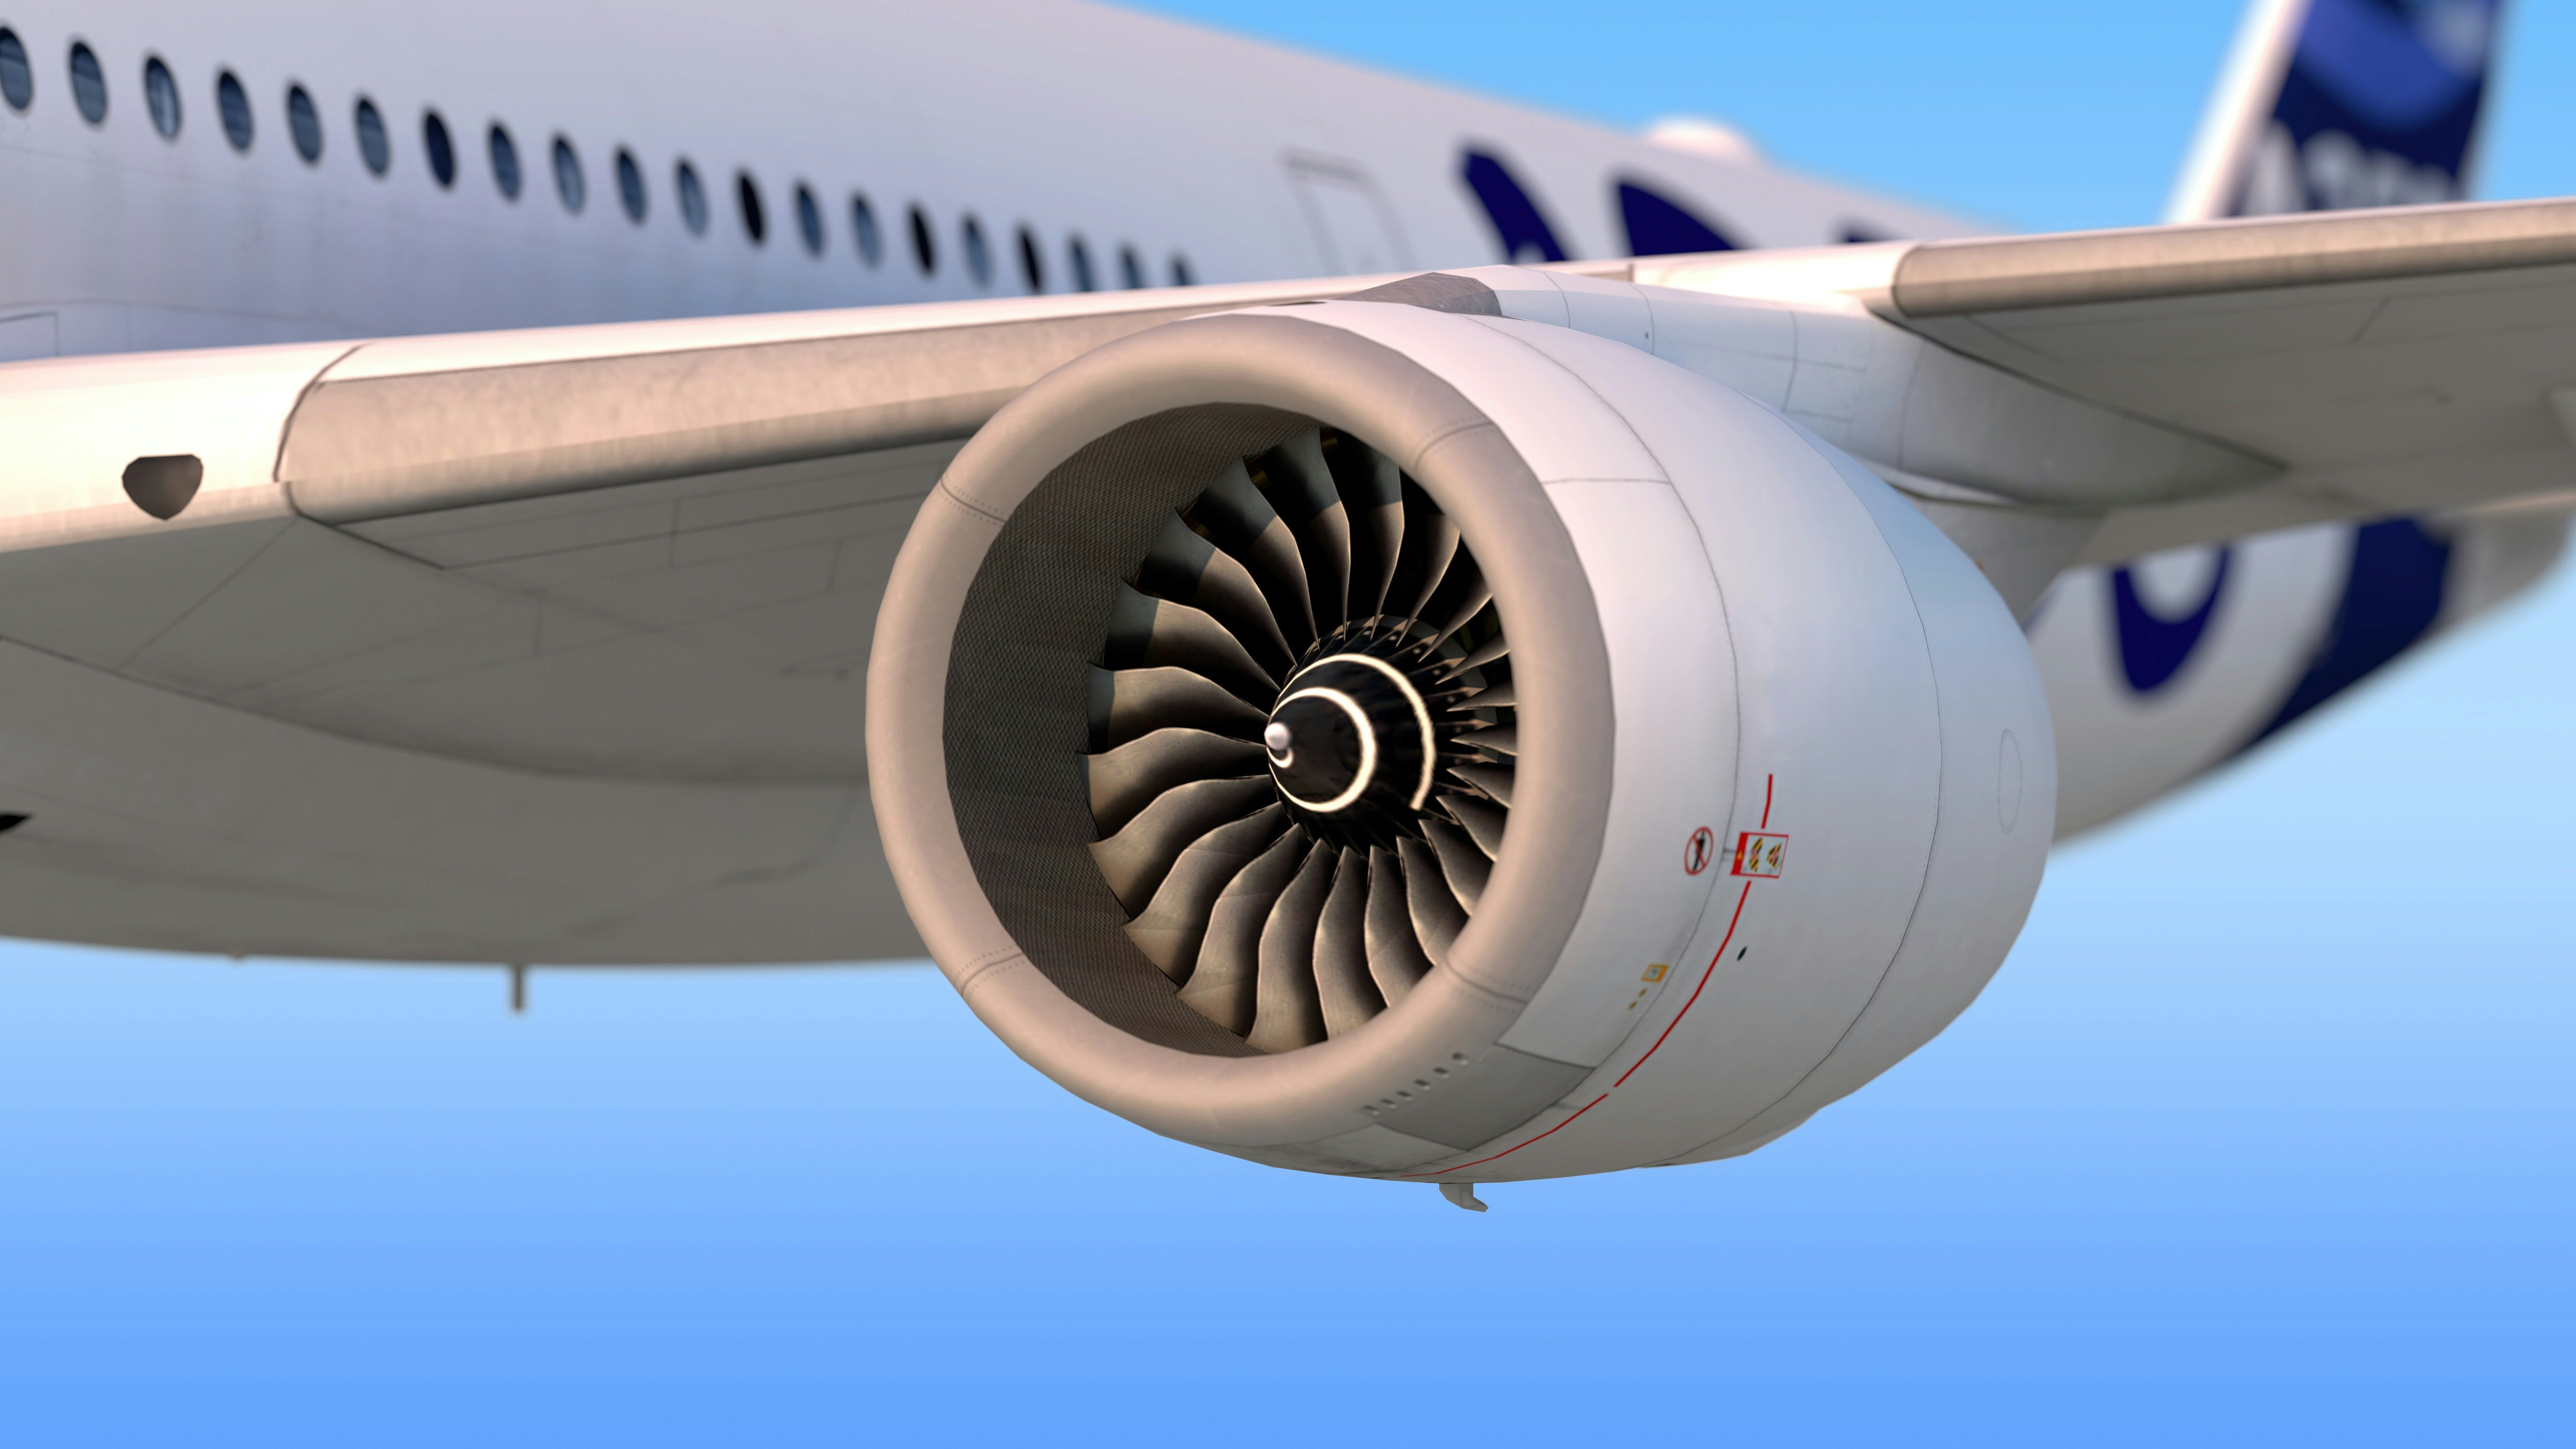
Airlines face a version of your problem every time a jet engine needs maintenance. An engine on the ground is an aircraft not flying, which is revenue not earned. The economics are brutal: a shop visit can take 120 to 210 days. Downtime is existential.
So carriers outsourced.
Rolls-Royce pioneered a model called TotalCare, essentially “power-by-the-hour.” Airlines pay a fixed fee per engine flight hour. Rolls-Royce assumes the maintenance cost and uptime risk. Advanced telemetry monitors engine health in real time. Availability becomes someone else’s problem.
Sound familiar? Fixed monthly fees. Uptime guarantees. Predictive maintenance through remote monitoring. Contract compression is TotalCare for wellbores.
The numbers are instructive. Rolls-Royce has been systematically extending time-on-wing through durability upgrades, including an upgraded Trent 1000 high-pressure turbine blade that more than doubles service intervals (EMD Compression anyone?). The economic logic is self-reinforcing: longer intervals mean fewer shop visits, lower lifecycle cost, and happier customers willing to sign longer contracts. Compression providers have absorbed this lesson. Average time on location now exceeds six years, with 60 to 65 percent of contracts structured for periodic repricing.
But here is where the airline parallel gets interesting. Carriers are not passively accepting this arrangement. They are selectively pulling work back in-house.
When Airlines Decided to Build Leverage
easyJet recently announced it is acquiring SR Technics’ Malta operation and the Adria Tehnika facility in Slovenia. The carrier already handles roughly a quarter of its heavy maintenance internally. It has also purchased additional spare engines to improve resilience and reduce disruption risk.
Why? Because in a market where MRO capacity is constrained and shop slots are scarce, control matters. Deutsche Bank characterizes the current environment as one where demand for flight services and maintenance exceeds industrial capacity. Jefferies notes pricing tailwinds on spare parts. Goodbody describes an “engine-MRO super cycle” with GE, Rolls-Royce, and Lufthansa Technik investing heavily to expand overhaul capacity.
The translation for compression is direct. Utilization across scaled fleets sits in the mid-90s. New equipment faces approximately 60-week engine lead times. Capacity reservations, not just capital, determine start dates.
easyJet’s response is not full insourcing. It is a mixed model: maintain power-by-the-hour coverage for certain fleets while building internal capability and spare engine pools that provide flexibility and negotiating leverage. On its fiscal 2025 call, management acknowledged GE PBH coverage today but flagged the need to plan for future LEAP shop visits independently.
Emirates took a different path. It secured rights to perform MRO on its Trent 900 engines in Dubai while simultaneously extending TotalCare contracts into the 2040s. The hybrid approach preserves risk transfer while building internal capability and slot access within Rolls-Royce’s network.
Both carriers arrived at the same insight: you do not need to own everything to shift the negotiating dynamic. You need to own enough to set an internal benchmark and demonstrate credible alternatives.
The Exchange Engine Trick You Should Steal
Here is a cost-reduction lever that deserves more attention in oil and gas: modular exchange programs.
FTAI Aviation operates a model where carriers can swap an entire engine or module in as little as 48 hours versus lengthy shop-visit induction queues. Their turnaround times run 45 to 80 days compared to 120 to 210 days for traditional MRO. Customer downtime during an exchange is zero to three days.
The magic is inventory positioning. FTAI maintains rotable pools of engines and modules, combined with proprietary PMA parts and in-house repair capabilities. Jefferies describes the integrated inventory and repair ecosystem as aimed at becoming the “lowest-cost producer of aftermarket power.”
Compression operators should be thinking about this. Standardization around CAT 3400, 3500, and 3600 engines with Ariel frames preserves resale and redeployment value. A small exchange pool of standardized skids, combined with module and component swap capability, could materially accelerate restart times and reduce downtime revenue loss. Typical outsourced availability guarantees run 95 to 98 percent. A 4 percent availability delta can swing operator revenue by approximately $225,000 per unit on gas-to-sales and roughly $450,000 on gas-lift applications.
The aviation playbook is clear: if downtime is expensive and capacity is scarce, hedge your slot access. Pre-book maintenance windows. Stagger interventions. Build a rotation capability that keeps production humming while equipment cycles through service.
Industrial Gases: The Vertical Integration Precedent
Aviation offers one template. Industrial gases offer another, arguably closer to the structural reality compression providers inhabit.
Large industrial gas users face a classic make-versus-buy decision. Steel plants, refineries, and chemical facilities need massive quantities of oxygen, nitrogen, and hydrogen. The question is whether to outsource under long-term “over-the-fence” contracts or own captive production.
Air Liquide operates approximately 9,700 kilometers of oxygen and hydrogen pipelines across Northern Europe and the U.S. Gulf Coast. Contracts typically run 15 to 20 years with take-or-pay protection. Energy is the single largest cost, so majors embed escalation and pass-through clauses while driving productivity to stabilize margins.
The contract structures are remarkably similar to compression. Fixed monthly commitments. CPI or market-rate adjustments. Uptime responsibility transferred to the supplier. Revenue visibility for the provider, cost predictability for the customer.
But here is where the industrial gas story diverges. Large steel makers are increasingly choosing to own captive air separation units rather than outsource.
Linde India notes in its recent annual report that the BOO (build-own-operate) outsourcing model is losing appeal as large users favor control over supply, energy sourcing, and margins. When you are running a blast furnace at scale, the economics of owning your oxygen plant start to pencil differently than when you were smaller and less certain about utilization.
That sounds a lot like unconventional oil and gas today. Early shale was uncertain. You did not know what the factory would produce, so you rented flexibility. That uncertainty is mostly gone. Wells are predictable. Development is geographically concentrated. The seven-year ROI on purchasing compression equipment outright that midstream players have long enjoyed starts looking achievable for E&Ps with sufficient scale and density.
The Anchor-Plus-Merchant Model
Industrial gas majors figured out something compression operators should study: you do not have to choose between full insourcing and full outsourcing. You can blend.
Air Products’ fiscal 2025 revenue mix shows 52 percent on-site production, 44 percent merchant sales, and 4 percent equipment sales. The anchor-plus-merchant model commits core production to dedicated customers while enabling redeployment of incremental capacity to monetize merchant volumes and spread fixed costs.
Linde India’s new air separation units near Tata Steel will supply both the anchor customer and local merchant demand. Same infrastructure, multiple revenue streams, higher utilization.
The translation for compression is straightforward. Commit core horsepower to critical wells under long-tenor, minimum-take constructs. Enable redeployment of surplus capacity to nearby users during off-peak periods. Run the compression fleet more like a pipeline network and less like a rental fleet.
The compressed gas majors also figured out that network scale matters. Headered, shared infrastructure pools loads across multiple demand points, raising utilization and lowering unit cost. Brownfield expansions piggybacking on existing pipelines offer efficient capital deployment. Air Liquide recently targeted $50 million in brownfield additions on the Gulf Coast to extend hydrogen capacity efficiently by leveraging existing infrastructure.
Operators with geographic concentration should be asking whether headered compression across multiple pads could achieve similar economics. The physics are different from gas pipelines, but the principle of pooling load to raise utilization is identical.
Comparative Economics: What the Numbers Actually Say
Let us be concrete about the numbers driving these decisions.
Aviation maintenance costs: Traditional MRO shop visits: 120 to 210 day turnaround Exchange/modular repair: 45 to 80 day turnaround Customer downtime during exchange: 0 to 3 days Cost reduction from used serviceable material and exchange programs: roughly 25 to 35 percent over time
Industrial gases contract structures: On-site/pipeline tenor: 10 to 20 years Minimum take-or-pay provisions: Standard Energy cost pass-through: Embedded in contract pricing formulas Air Products revenue mix: 52 percent on-site, 44 percent merchant
Compression market dynamics: Fleet utilization: Mid-90s to high-90s across scaled providers Monthly tariffs: $21 to $24 per horsepower Engine lead times: Approximately 60 weeks Average time on location: Greater than six years Provider gross margins: Roughly 68 to 73 percent
Transaction multiples for context: USAC acquiring J-W: Approximately 5.8x 2026E EBITDA, roughly $1,015 to $1,050 per horsepower Archrock acquiring TOPS: Approximately 7.3x at roughly $1,695 per horsepower Archrock acquiring NGCS: Below 7.0x at roughly $1,130 per horsepower
The market is telling you that compression assets trade at infrastructure-like multiples because they behave like infrastructure. The question is whether you want to be a buyer at those multiples or find another way to capture the value.
The Hybrid Strategy Playbook
Experts across compression, aviation, and industrial gases converge on a consistent recommendation: mixed models outperform pure strategies.
From compression industry experts: Consolidation and longer five- to seven-year terms have strengthened pricing power. Electric units often move to month-to-month after initial terms, providing flexibility but exposing buyers to prevailing market rates. Fleets are highly utilized, with larger mobile units favored and quick redeployment into premium basins.
From airline executives: Large carriers insource heavy work but consistently outsource a tranche based on availability and price under long-term arrangements. The approach reflects risk aversion and capacity hedging.
From aviation MRO specialists: Exchange engines and module swaps can trim turnaround times by about 20 percent when combined with used serviceable material availability. Operators often prioritize turnaround time over price to keep aircraft productive.
From industrial gas veterans: Large users adopt on-site or pipeline supply with 15 to 20 year contracts and minimum take-or-pay to recover capital, with margins earned on volumes above the floor. Once plants are paid down, customers push back on pricing, but the efficiency risk sits with the supplier.
The actionable guidance for E&Ps synthesizes these perspectives into three pillars:
Contract design: Anchor a take-or-pay baseline for critical horsepower with CPI and energy pass-throughs. Add efficiency “reopener” clauses. Negotiate month-to-month tails post-initial term for flexibility.
Capacity hedging: Pre-book maintenance windows and stagger interventions. Build a small exchange pool of standardized skids. Allow module and component swaps to accelerate restarts and reduce downtime.
Mixed model: Insource a targeted share to set internal benchmarks and surge-response capability. Outsource the balance under long-term arrangements to transfer uptime risk and preserve capacity options.
The critical insight is that you do not need to own everything. You need to own enough to establish a credible internal reference cost. That reference cost becomes your leverage in every subsequent negotiation.
What This Means for the Insourcing Decision
Last week we posed the question: what is your plan? This week we have the framework for answering it.
The insourcing decision scorecard should evaluate several factors:
Horsepower intensity and mobilization economics: Rule-of-thumb mobilization and demobilization for a large horsepower unit exceeds $100,000. Multi-unit pads can exceed roughly $500,000 per site. Ownership wins when redeployments are frequent or locations are long-lived.
Uptime criticality: Typical outsourced guarantees run 95 to 98 percent mechanical availability. Justify insourcing only if internal operations and maintenance can credibly beat those guarantees.
Lead-time exposure: Outsourced providers report approximately 60-week lead times on larger orders. Owning does not eliminate supply constraints unless you pre-buy or secure used inventory.
Capital and O&M capability: Outsourced fleets are standardized around Caterpillar and Ariel with telematics across units. Match this in-house to avoid higher lifecycle cost and lower uptime.
Energy strategy: Electric motor drive offers superior uptime and lower maintenance where power is available. Grid constraints can cap realizable benefits. Plan for dual-drive flexibility.
A simple comparison: Annual outsource cost equals tariff times horsepower times twelve, minus SLA credits. Insource total cost of ownership equals depreciation plus financing plus planned maintenance plus fuel or power plus field labor plus expected downtime revenue loss. Include mobilization costs and lead-time slippage penalties.
Run the math. Airlines and industrial gas users did not guess their way into hybrid models. They quantified the inflection point where partial ownership changed the economics.
The Contrarian Take
The consensus view is that compression consolidation leaves operators with fewer options and higher costs. That is true but incomplete.
The more interesting observation is that the same consolidation creating pricing pressure is also creating the conditions for insourcing to pencil. When three companies control 75 percent of the outsourced market and earn 70 percent margins, the economics of vertical integration improve mechanically. The spread between outsourced cost and insourced total cost of ownership widens. The internal rate of return on ownership assets goes up.
Aviation and industrial gases teach us that this dynamic has a natural endpoint. At some threshold of supplier pricing power and margin capture, large users begin bringing production back in-house. Not all of it. Enough to establish benchmarks, create options, and restore leverage.
The compression market is approaching that threshold. The USAC acquisition of J-W is not the end of consolidation. It is the beginning of the response.
Over the coming weeks, we will run the math on different insourcing entry points, model the hybrid strategies that airlines and gas users have deployed, and outline specific contract structures operators can use to respond.
Because when your conveyor belt provider starts earning margins that look like your margins, rational manufacturers do what they have always done.
They bring the factory home. One module at a time.
Thanks for reading Kalibr - Strategy Research for Oil & Gas! Subscribe for free to receive new posts and support my work.