

Known Unknowns | Frac Q4 2025 Review
They Scrapped the Cheap Fleet and Filed an 8-K About It.

Imagine you manufacture a specialized tool. Clients hire you for the tool and the people who run it. The faster you work, the cheaper it gets for them. The faster you work, the more jobs you spread your fixed cost across, and the cheaper it gets for you. This is the part of the business school lecture where everyone nods, because it is straightforward and good, and straightforward good things feel nice before the next slide.
Then it gets harder. Your tool is not that difficult to replicate, and your client base consolidates faster than your competitors exit, which means more buying power on one side of the table and a price war developing on the other. You respond the way every serious operator responds: tighter geography, vertical integration, proprietary systems, performance contracts. These work. Mostly. But you are still selling a commodity, and commodity sellers eventually compete on price, and competing on price is a terrible way to spend a career.
So you build a better tool. Not incrementally better — fundamentally different. A tool that nobody else has yet, that demonstrably cuts your client’s cost per job, and that requires serious capital commitment on your part to deploy. Here is where it gets interesting: your client is playing a completely different game. They are a cash flow maximization program. They have a board expecting returns, a buyback target to hit, and a CFO who measures success in dollars returned to shareholders, not equipment purchased. They love the story of cost reduction. They will put it in their investor deck. What they will not do is write the check to make it happen. So when you show up with the better tool and ask for term in exchange for making the capital commitment yourself, they are not reluctantly agreeing. They are relieved. The term contract is not a concession — it is the product. You get EBITDA predictability and the investment thesis to deploy capital. They get the technology, the narrative, and none of the depreciation. Everyone shakes hands and actually means it for once.
The problem is the old tool. You still have a fleet of them. In a soft market, clients ask for the old tool and make you compete on price, which pulls your blended margin back toward a number your CFO mentions at every ops review with the same face. You cannot unilaterally retire them without ceding share to competitors who still offer them. You cannot call your competitors and agree to retire the old tools together, because this is fundamentally not how capitalism is supposed to work. Lina Khan may no longer be running the FTC, but the Sherman Act did not leave with her.
What you can do is make a series of carefully worded public statements — in earnings calls, in investor decks, in the particular register of language that sounds like operational housekeeping but lands as strategy — indicating that you are not merely taking the old tools out of service. You are dismantling them. Parting them out. Making the retirement structurally irreversible, not just temporarily inconvenient. Your competitors are listening, because they have the same problem and the same CFO giving them the same look. They may reach the same conclusion independently. The old tools disappear from the market without anyone having to say anything that a regulator would find interesting.
This is, roughly, what happened to conventional diesel frac fleets over the course of 2025. The Q4 earnings cycle just told us whether it worked. The short answer is yes. The more interesting answer is that “it worked” created a follow-on problem that now belongs entirely to E&P operators: where the old market had one commodity tier and some premium options, the new market has three distinct next-generation architectures with different economics, different operator fit, and very different responses to a buyer who shows up without a credible alternative. Someone has to understand what they are. It might as well be you.
1.1 Million Horsepower Walked Out the Door and Nobody Is Replacing It
Let’s do the ledger first, because the numbers are specific enough to matter.
The D&C index sits at 75 — down from 100 in 2015 — while the staffing index has doubled to 18. Operators are completing more wells per crew, returning more capital per barrel, and running programs explicitly designed to outperform at $61/bbl. That backdrop matters because it explains the behavior on the service side. When your client base is structurally committed to doing more with less, the rational response is to concentrate capital where the returns are highest and liquidate everything else. That is exactly what happened.
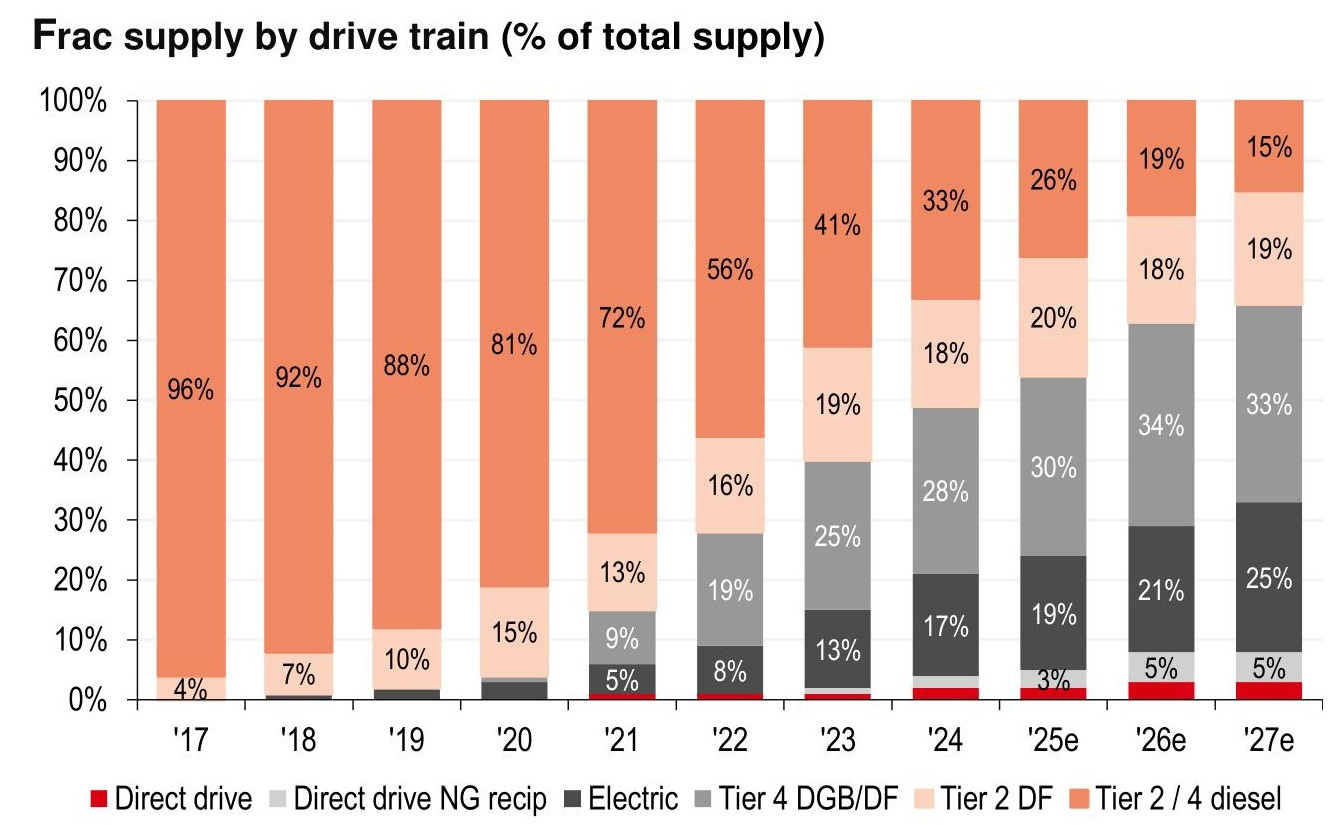
Over 2024 and 2025, the top five pressure pumping providers retired, impaired, or scrapped more than 1.1 million hydraulic horsepower of conventional diesel equipment. Patterson-UTI removed 600,000 HHP over two years. ACDC retired 400,000 HHP in a single quarter. ProPetro took a $189 million write-down and described the remaining diesel fleet as being “harvested for cash” with zero maintenance CAPEX. Halliburton described their conventional idle capacity as “consciously stacked and price-dated,” which is a slightly more collegial way of saying the same thing. Liberty Energy cannibalized their legacy equipment for spare parts. In no case was any of this equipment stacked while awaiting a better market (with the exception of HAL). It was stripped for transmissions and power ends, written off, and in several cases physically scrapped.
Zero dollars replaced it in kind. Not one provider discussed building new Tier 4 DGB equipment on any earnings call across eight consecutive quarters. The existing Tier 4 fleet is the fleet. Minus annual attrition, which nobody is replacing either.
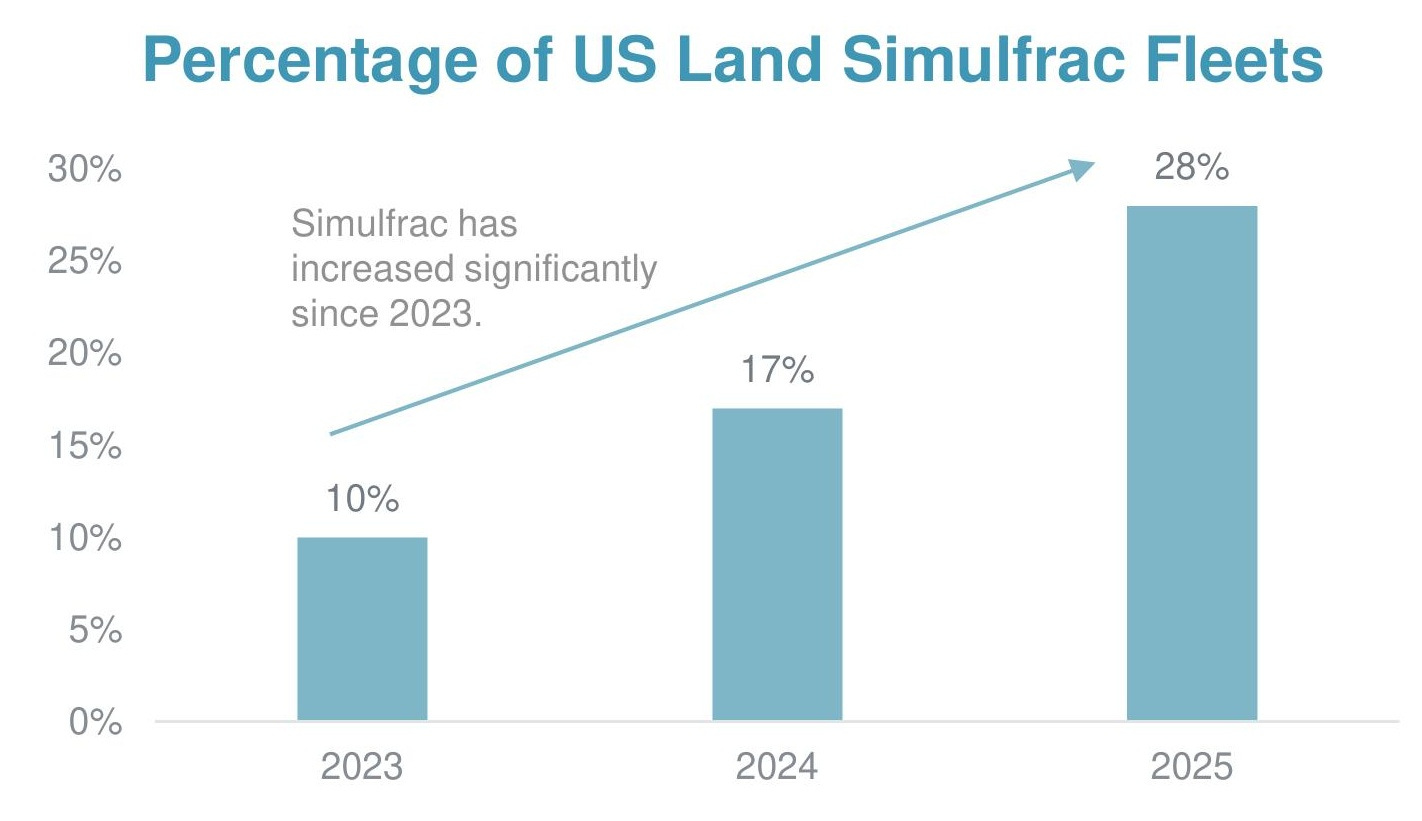
This does not mean Tier 2 and Tier 4 DGB equipment vanished. It means they became something different: the new commodity floor. The old commodity tier was Tier 2 diesel. The new commodity tier is Tier 4 DGB — the equipment that every provider still has in some quantity, that sets the baseline market price, and that service companies are increasingly trying to deploy in simul-frac configurations rather than single-well operations. The reason is straightforward: running two wells simultaneously with Tier 4 DGB requires more horsepower per location, reduces crew count relative to stages completed, and improves service company margin per job without requiring newbuild capital. Your vendor’s enthusiasm for getting you onto simul-frac with their conventional fleet is not purely about your cost structure. It is also very much about theirs.
Every dollar of newbuild capital went above the commodity tier. And the thing about next-generation equipment in frac is that it is not one thing — it is three distinct things, each with a different power source, a different capital structure, and a different answer to the question of which operators it actually fits.
The Part Where We Explain That “Electric Fleet” Is Not One Fleet
The conventional framing in E&P operations is: there are old diesel fleets, and there are new electric fleets, and you should try to get the new electric fleets because they are better. This framing is approximately true the way “a plane and a helicopter are both aircraft” is approximately true. Useful at 30,000 feet. Unhelpful when you are trying to figure out which one lands in your backyard.
Every dollar of newbuild capital is flowing into one of three distinct architectures. They share a fuel source and a general direction of travel. They do not share a capital cost, an operating envelope, or an operator fit.
HAL Zeus runs aircraft-derivative gas turbines generating ~35MW of continuous electrical output distributed across purpose-built electric pumps. At approximately $60 million per fleet it is the most capital-intensive deployment in the peer group — and build-to-contract only, meaning no spot market exists. The operational payoff is real: Zeus executes simul-frac at ~65,000 HHP versus 100,000 to 120,000 HHP for legacy configurations running the same job design. The switching cost is structural. Zeus deployments embed wellsite power infrastructure, data integration, and choreography that is incompatible with any competitor fleet. Operators who built programs around Zeus efficiency metrics have created a durable relationship with Halliburton whether or not they intended to.
LBRT digiFrac and digiPrime are two distinct platforms that Liberty’s investor materials tend to flatten into a single “natural gas fleet” narrative. digiFrac is a clean-sheet purpose-built electric pump with the best utilization record in the peer group: 7,143 pumping hours per year on a single fleet, representing 96% of the calendar (~19.5 effective hours per day) at operating pressures exceeding 10,000 psi. digiPrime is mechanically different — a variable-speed natural gas reciprocating engine in direct mechanical coupling, eliminating the electrical conversion step. Lower capital cost, simpler infrastructure, and a program fit that does not require Permian-scale pad operations to justify the economics.
PTEN Emerald takes the mechanical drive premise further still. No turbine, no electrical system, no conversion losses — natural gas combustion to pump motion in a single step. Capital runs 25 to 30 percent below a full e-fleet at 100% diesel displacement. The differentiation from Zeus and digiFrac is program fit: Emerald does not require the water logistics of trimul-frac (~330,000 bbl/day versus ~110,000 for a conventional zipper) and works in basins and completion designs where pad scale cannot support electric fleet economics. You change the iron. You do not change the program.
The Part Where We Pull Out a Calculator
The conventional way to track frac market tightness is total horsepower. Count the active fleets, multiply by nameplate HHP, compare to demand. This number is now systematically misleading, and the operators still using it are making procurement decisions with a broken instrument.
Total horsepower deployed across the peer group remained roughly consistent through 2025 even as fleet counts declined. The reason: simul-frac and high-efficiency operations require 30 to 100 percent more horsepower per job than conventional single-well pumping. A market that looks flat in raw HHP terms is actually tightening in job capacity. The retired Tier 2 diesel was completing approximately 60 percent of the stages per month of a next-generation fleet. When you retire 1.1 million HHP running at 60 percent efficiency and replace part of it with equipment running at 95 percent, the aggregate horsepower number goes down but the job capacity does not. What also does not survive the transition is the pricing that attached to the old equipment.
The E&P operations engineer benchmarking their 2026 frac budget against 2023 actuals is comparing against a market that no longer physically exists. The equipment that set those prices has been parted out. What replaced it has a different cost structure, different margin expectations, and a very different answer when a buyer shows up without a credible alternative.
Q4 2025 Earnings: What the Numbers Actually Said
The Q4 2025 earnings cycle is the most useful dataset this peer group has produced in several years, for a straightforward reason: soft markets make financial disclosures honest. The narrative in prepared remarks — “steady,” “resilient,” “disciplined” — runs about two minutes before the analyst Q&A begins disassembling it. The job is to read the transcripts, the 10-Ks, and the broker notes together, and build a vendor picture based on what the numbers require rather than what management preferred to say.
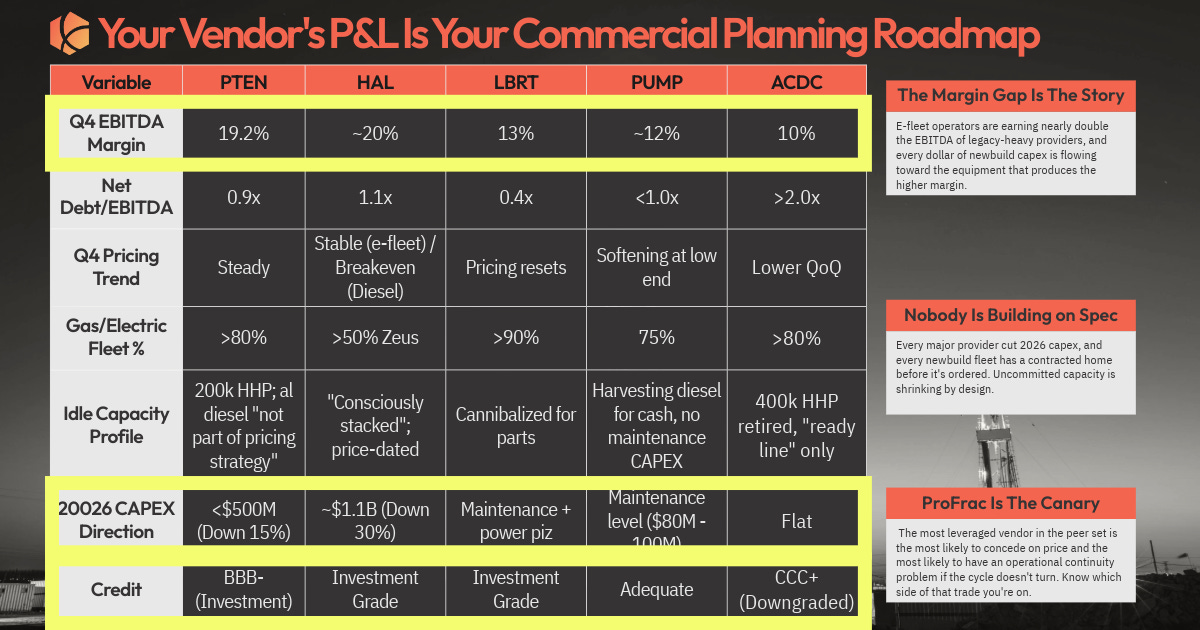
What follows organizes five companies across the contracting dimensions that actually matter before you sign a 2026 completion program. Margins and leverage matter for obvious reasons. Pricing trajectory, customer concentration, capital posture, and management tone matter because they determine how this vendor behaves in a renewal negotiation and what happens to your program if their internal situation changes mid-contract.
Patterson-UTI (PTEN)
Q4 EBITDA margin: 19.2% — up 60bps sequentially on flat revenue of $1.15 billion. Margins expanding while revenue holds flat is a cost structure story, not a pricing power story. The company’s Q4 free cash flow came in at $259 million against a $167 million analyst consensus — a 55% beat. Approximately $15 million of that came from customer prepayments for 2026 work, which is itself a negotiating data point: counterparties who prepay are telling you something about their view of available alternatives. Net debt down to $822 million from $1.06 billion at Q3, at 0.9x net debt/EBITDA. No senior note maturities until 2028. Total liquidity $739 million. Fitch affirmed BBB- with stable outlook in August 2025. A 25% dividend increase to $0.10 per share — a signal of confidence in sustained cash generation that is harder to fake than a management quote.
The vendor that raises its dividend 25% in a flat market has decided it does not need your volume badly enough to discount for it. That is the first thing to understand about negotiating with PTEN in 2026.
What the pricing language actually says: Management described Q4 rates as “steady” — the same word used in Q3, which they also called “steady.” Barclays analyst Sungeun Kim identified the gap: Q1 2026 Completion Services gross profit guidance of $95 million represents a roughly 14% sequential decline against activity characterized as only “slightly” lower. Her question: “That would seem to imply a not insignificant pricing decline. Is that a fair assessment?” CEO Andy Hendricks responded “Not at all” and attributed the gap to weather and mix. Companies that are genuinely holding price explain the arithmetic. Companies managing the narrative change the subject. The gap between the word “steady” and the implied math in the Q1 guide is real and belongs in your model.
Completion services contract structure — what the frac business actually looks like commercially: PTEN’s completion programs reset annually. Dedicated fleet pricing is negotiated at year-end and “locked in place” for the coming year — management’s language, not a summary. Spot work fills calendar white space between dedicated programs, at whatever the market clears. Approximately 10% of completion work has shifted to performance-based agreements, where compensation is tied to efficiency outcomes rather than a fixed stage or hourly rate. That last number matters for a renewal negotiation: the buyer who enters a performance-based discussion expecting to benchmark against a simple dayrate is negotiating the wrong contract type against the wrong variable. The customer prepayment signal — roughly $15 million in advance payments for 2026 work embedded in the Q4 FCF beat — tells you something about how the customer base is sorting. Counterparties who prepay have decided that their alternative is worse than locking in early. Counterparties who did not are either testing the spot market or waiting to see if Q1 weather and pricing headwinds create an opening. Knowing which of those you are is the operational intelligence question.
Where the pricing power is real: PTEN was explicit that natural gas-capable equipment — roughly 85% of active fleet horsepower by year-end 2026 — is operating at near-full utilization with “minimal spare capacity.” Management predicted the gas fleet would be “essentially sold out” by Q2 2026. If that proves accurate, and Haynesville and Appalachian activity responds to LNG-driven demand as modeled, the pricing leverage dynamic for gas-capable units shifts sharply toward the vendor in H2 2026. The Permian is a different market. West Texas pricing is, per PTEN’s own words, “certainly still competitive” relative to gas basins. Buyers sourcing Permian oil-weighted programs have more room in 2026 than buyers competing for gas basin capacity.
What management conceded under pressure: When calendar white space appears, PTEN fills it at spot, and spot means a lower price. Exact language: “if there’s any white space in the calendar... we have to fill some dedicated work with some short-term spot work, maybe we take a little bit lower price to do that.” That admission is a procurement playbook. A buyer who delays award decisions or deliberately creates scheduling gaps is creating exactly the condition that triggers PTEN’s spot market behavior. Whether that tactic makes sense for your program depends on how much program continuity risk you are willing to carry in exchange for a rate concession.
Customer concentration: Top customer at 12% of consolidated revenue for full year 2025. Top five: 39%. Top ten: 57%. Roughly 60% of revenue from the 15 most active U.S. E&Ps — large public and large private, structurally resilient but also the customers PTEN cannot afford to lose, which provides leverage to that cohort in renewal discussions. Performance-based agreements now cover approximately 10% of completion work — a contract structure that protects PTEN’s revenue from dayrate deflation by tying compensation to efficiency outcomes. The buyer who pushes purely on rate against a performance contract is negotiating the wrong variable.
Halliburton (HAL)
Q4 adjusted operating margin: 19.8% — the highest in the peer group, up 130bps sequentially. Before using this as a benchmark for anything, read the Q&A. CFO Eric Carre confirmed that over half of the guided 300bps margin compression for Q1 2026 is explained by the non-repeat of year-end completion tool sales — a transactional event that inflates Q4 and disappears from Q1. Anyone using HAL’s Q4 C&P margin as a run-rate for North American frac profitability is using the wrong input. The underlying run-rate is closer to the Q1 guide than the Q4 print.
Balance sheet: Net debt $4.95 billion at year-end, down from $5.4 billion in Q3. Net debt/EBITDA 1.2x at investment-grade (BBB+/A3). Total liquidity approximately $5.7 billion. Q4 FCF $875 million; full year $1.9 billion. The company returned 85% of annual FCF to shareholders and repurchased $1 billion in stock during 2025. The 2026 CAPEX budget is down 30% from 2025 — the largest percentage reduction in the peer group.
The contracting implication of the North America guidance: HAL explicitly guided to a high-single-digit decline in North American revenue for 2026. The highest-margin vendor in this peer group is deliberately shrinking its North American completions business. CEO Jeff Miller: “Pricing reaches a point where it’s not... companies aren’t investing in it. We are moving equipment away from it.” That statement functions as a credible commitment to supply withdrawal only because HAL actually has an alternative — 59% of total revenue is international, growing 7% sequentially in Q4. A vendor who genuinely does not need North American volume to cover overhead can execute a withdrawal threat. Most vendors cannot. HAL can. This changes the negotiating dynamic in a specific way: HAL is not a vendor who will chase your program at a concession to maintain utilization. The question for E&P procurement is whether the premium over comparable conventional services is justified by the performance differential — because HAL is not offering a discount path to find out.
Customer and counterparty risk — one number that belongs in any complete HAL analysis: The company entered into $750 million in Credit Default Swaps to hedge receivables exposure to Pemex, which represents 11% of total receivables. This reflects a working capital risk in the consolidated entity that does not appear in the North American completions P&L but affects overall financial positioning. The significance for E&P buyers is indirect but real: a company managing concentrated international credit risk may price NAM work differently than its standalone NAM margins would suggest.
What the stacking strategy means operationally: HAL stacked fleets in Q3 and continued stacking in Q4 — voluntarily, at rates that management characterized as “not economic.” The crews associated with stacked fleets do not stay on payroll indefinitely. The personnel who run HAL’s most complex completion systems are specialized and mobile. A sustained period of voluntary capacity withdrawal has implications for the speed and cost of reactivation if demand recovers sharply. The vendor who confidently withdraws supply in a soft market is also the vendor who faces the steepest reactivation cost if the market inflects faster than they modeled. That asymmetry is worth tracking.
Liberty Energy (LBRT)
Q4 EBITDA margin: 15.2%, up from Q3’s 13.5%. Revenue grew 10% sequentially — the strongest sequential revenue print in the peer group. Balance sheet: net debt $219 million at year-end at approximately 0.4x net debt/EBITDA — the lowest leverage ratio in the group. Total liquidity $281 million, up from $146 million at Q3.
The pricing disclosure that should be in your file: Liberty was more specific than any other company in this peer group, and the specificity is analytically useful precisely because the content is unfavorable to the vendor. CEO Ron Gusek quantified the Q4 RFP season impact as “low to mid-single digits” below H2 2025 rates — confirming that dedicated customers who demonstrably value Liberty’s operational record still extracted price concessions during the annual contract reset. His description of the trend: “a slow and steady trend downwards” from the mid-2022 peak. Goldman Sachs analyst Ati Modak pushed directly on the contradiction between “flight to quality” and concurrent pricing concessions. Gusek’s answer: competitors “find white space” and defend share with price, “we are not immune to these market forces.” That sentence is worth its own line item in any Liberty renewal discussion. The vendor who publicly acknowledges they cannot hold price against commodity competitors is giving you the benchmark for your next negotiation.
Why this matters for contracting beyond the rate: The RFP process that drove these concessions ran during Q4 2025, when activity was soft and buyer leverage was highest. The rates set in that process are locked for 2026. If the gas demand inflection that LBRT (and PTEN) are predicting for H2 2026 materializes, those rates will look increasingly favorable to Liberty — and they will have the utilization data and market conditions to push for higher rates at the next annual reset. Operators who locked term in Q4 2025 captured the trough pricing. Operators renewing in Q4 2026 may be negotiating in a different market. The timing of your commitment is itself a pricing decision.
Capital allocation — the most consequential signal in this quarter’s disclosure: 2026 completions CAPEX approximately $250 million, of which roughly $175 million is maintenance. Power generation CAPEX: $725 million to $900 million, targeting 3 gigawatts of deployed capacity by 2029. That ratio — $3.50 to $3.60 of power capital for every dollar of frac capital — is a clear statement of where growth investment is going. CFO Michael Stock confirmed capex is “markedly shifting” toward power with completions in maintenance mode. The specific phrase: “No digi builds in 2026.”
What this means for a multi-year completion contract: Liberty’s frac business has formally entered harvest mode to fund a power infrastructure buildout. The business runs well today — the Q4 operational numbers support that. The question for an E&P operations team evaluating a 2026-to-2028 term contract is whether frac continues to receive the management attention and equipment investment that the current operational record reflects. The $800 million per year flowing to LPI is not flowing to frac fleet quality. Maintenance CAPEX budgets on existing equipment set the reliability trajectory. The gap between “maintenance mode” and “adequate maintenance” is what your completion cost per foot eventually measures.
Customer concentration — monitor the ExxonMobil exposure: Occidental Petroleum and ExxonMobil each exceeded 10% of 2025 revenue. The ExxonMobil position warrants specific attention given ProPetro’s parallel and disclosed non-renewal situation for two FORCE electric fleets contracted to the same operator. Whether the ExxonMobil programs in Liberty’s portfolio carry equivalent renewal risk is not publicly disclosed — but a procurement team that knows ExxonMobil is actively restructuring its vendor commitments across multiple service providers should be asking the question directly rather than waiting for it to appear in a 10-K.
ProPetro (PUMP)
Q4 EBITDA margin: Estimated at approximately $32 to $34 million total — a run rate suggesting roughly 11-12% margin on the completion services business. The organizing fact for ProPetro in 2026 is not the margin. It is the customer concentration.
The ExxonMobil situation in plain arithmetic: ExxonMobil accounts for approximately 19.7% of total ProPetro revenue. Per ProPetro’s own prospectus filing dated January 2026, the agreement governing two FORCE electric fleets for ExxonMobil expires in late 2026 and is “not expected to be renewed.” Permian Resources: 14.9% of revenue. EOG Resources: 10.6%. Top five customers: 58.8% of revenue. Top ten: 75.3%. ProPetro derives 98.5% of fleet revenue from the Permian Basin. When approximately one-fifth of your revenue from a single customer is disclosed as non-renewing in your own SEC filing, the follow-on question for every other customer in the portfolio is whether their program pricing reflects a vendor under competitive pressure to replace that volume. It usually does.
The equity raise tells the story that the earnings call could not: ProPetro launched a 12.5 million share equity offering in January 2026 specifically to fund ProPWR growth capital. The timing — equity raise at cyclical lows, simultaneously with a disclosed anchor-customer non-renewal — reflects a vendor whose organic cash flow from the core completion business is insufficient to fund its strategic pivot. Management has stated the completion business is in “maintenance mode.” The ProPWR book includes 220 MW of contracted power, including a 10-year Permian operator deal and a data center contract. The strategic logic is sound. The contracting implication for E&P buyers is more immediate: a vendor simultaneously managing a 20% revenue hole from a non-renewing anchor customer and redirecting capital to an adjacent business is a vendor whose internal resource allocation decisions deserve explicit conversation before any program is committed. The best equipment and most experienced crews go to the anchor programs. Understanding where your program ranks in that allocation is not a theoretical question in ProPetro’s current situation — it is the operational risk question.
The Permian density is real and belongs in the analysis: ProPetro’s operational density in the Permian Basin — 98.5% of revenue, infrastructure concentrated around a single geography — creates genuine logistical advantages that distributed competitors cannot easily replicate. Mobilization costs, crew familiarity, and local supply chain depth all improve at this concentration level. For a buyer running a Permian-only program with no geographic flexibility in their vendor set, ProPetro’s basin expertise offsets some of the customer concentration risk. The relevant question is what rate premium that density justifies relative to the negotiating leverage available from the current financial situation.
What “disciplined” actually means in this context: Management characterized Q4 pricing as “disciplined” — the word service companies use when they are trying to hold a line they find harder to hold than the word implies. Q3 pricing language was “weak.” “Disciplined” is the upgrade. The arithmetic behind the upgrade is that ProPetro reduced active fleet count from 13-14 in Q2 to 10-11 in Q3-Q4 — deliberately idling fleets to avoid working at sub-economic rates. A vendor who idles 20-25% of their fleet to protect pricing has made a specific judgment about where the pricing floor is. It also means 20-25% of that vendor’s revenue-generating capacity is sitting idle, which changes the math on how aggressively they need to fill what remains at what rate.
ProFrac (ACDC)
Start with the credit event, because everything else is organized around it: S&P Global Ratings lowered ProFrac’s issuer credit rating to CCC in January 2026 before withdrawing it at the issuer’s request. The withdrawal does not reverse the downgrade or the underlying conditions that produced it. Net debt: approximately $1.04 billion against $58 million in cash at Q3, at roughly 3.4x net debt/EBITDA — the highest leverage ratio in this peer group by a factor of approximately three. Q3 free cash flow: negative $29 million. The company executed a fourth amendment to its credit agreement in December 2025, reducing amortization payments and deferring leverage ratio testing to March 2028. The ABL facility becomes current in early 2026.
What 3.4x leverage at CCC-equivalent capital costs means operationally: The interest expense on $1.04 billion in net debt at current borrowing costs is consuming operating cash flow at a rate that limits the capital available for equipment maintenance, crew quality, and program investment. The $100 million annualized cost-saving initiative — covering SG&A (reduced 17% sequentially in Q3) and a headcount reduction executed October 2025 — is the organizational response to that constraint. Cost-cutting preserves liquidity. It does not improve the equipment maintenance posture. Q3 Stimulation Services segment EBITDA margin: 6%. West Texas pricing described as “competitive” — the word in this industry that means the vendor is not setting the clearing price, the market is.
The cost structure advantage is real and belongs in this analysis: ProFrac’s in-house manufacturing produces frac equipment at approximately $540 per HHP versus an industry average of approximately $861 per HHP — a 37% cost advantage on newbuild equipment. The company also owns sand mines and chemical manufacturing, capturing margin at multiple points in the completion cost chain that non-integrated competitors pay through. This is not trivial. The provider who can build at 63 cents on the dollar has a structural cost floor that competitors without equivalent integration cannot match. If ProFrac’s financial structure were different, this cost basis would translate into durable pricing power on the low end of the market.
The problem the cost advantage cannot solve: The interest expense on $1.04 billion in net debt at CCC-equivalent capital costs is consuming that operating advantage faster than the business regenerates it. The fourth credit agreement amendment is a deferral of the leverage ratio test, not a resolution of the underlying leverage. The buyer who negotiates the deepest rate concession from ProFrac — and the leverage for that negotiation is genuinely high, because the vendor needs cash flow to service debt and will price work accordingly — is the buyer with the highest exposure if a restructuring process interrupts mid-contract. Those two facts describe the same entity observed from opposite ends of the same problem.
The commercial pivot and its execution risk: Management’s 2026 strategy is to move from spot-heavy to dedicated programs, targeting 90%-plus of active fleet capacity on committed work. The rationale is sound — spot market pricing has converged with dedicated pricing, eliminating the premium that previously made spot market exposure attractive, and the “head fakes” in Q3 spot activity caused material operational inefficiency. A dedicated program base provides cash flow stability that the debt structure requires. The execution risk: restructuring commercial terms from a position of financial distress limits how aggressively ProFrac can negotiate the terms of those dedicated agreements. A counterparty who knows the vendor needs the volume to service its debt is a counterparty with a structural negotiating advantage in every discussion about price, equipment quality, and crew assignment.
The specific data point most buyers overlook: Spot pricing and dedicated pricing have converged. Per management: “spot and term pricing [are] pretty in line relative to each other.” The historical premium for accepting spot market volatility has disappeared. This means the buyer who previously used spot market pricing as a lever in dedicated contract negotiations has lost that benchmark. The market has done the compression for them. What remains is leverage derived from the vendor’s financial position — and that leverage is substantial and real, but it comes with the program continuity risk described above.
The Vendor Scorecard
Five observations the matrix reveals that the individual dossiers do not.
HAL and PTEN score identically in total, but for structurally different reasons. HAL’s score is anchored by balance sheet strength and willingness to credibly withdraw supply — genuine leverage backed by an international revenue base that does not require North American volume. PTEN’s score reflects operational consistency and margin quality. Where they diverge is on frac management attention: HAL’s active capital investment is migrating toward Zeus, which is a different negotiation than conventional tier. PTEN still has conventional capacity, even if it is being managed at the margin.
LBRT’s composite score (23) understates the operational quality of the frac business and overstates the risk — the score reflects the capital allocation signal, not a current performance problem. The business runs well today. The question is the 2026 and 2027 forward-looking answer when $800 million per year in growth capital is flowing to LPI rather than frac. That uncertainty loads the “management attention” and “program continuity” dimensions.
PUMP’s score of 18 reflects a specific, identifiable event rather than a general posture of weakness: the ExxonMobil non-renewal. A vendor managing a 19.7% revenue hole while raising equity to fund an adjacent pivot is a vendor whose negotiating position has narrowed for a specific window. The basin depth and operational density in the Permian are genuine, and they matter for a Permian program.
ACDC scores higher on buyer pricing leverage (5) than any other vendor and lower on program continuity (1) than any other vendor. Those two numbers describe the same entity observed from opposite ends of the same problem. The operator who negotiates the deepest rate concession from ProFrac is the operator with the highest exposure if a restructuring process interrupts mid-contract. That trade-off does not resolve without a specific view on whether the credit trajectory stabilizes.
The peer group’s aggregate management attention score on frac is the number that deserves the most scrutiny from an E&P operations team doing multi-year planning. Three of the five vendors in this peer group are actively redirecting growth capital away from frac. The equipment in the commodity tier is the equipment that exists today, managed on maintenance budgets that are at or below the floor required for standard PM intervals. That is the market you are contracting into in 2026.
TLDR: The Tool Manufacturer Won
Remember the tool manufacturer from the beginning of this piece. They had an old tool, a new tool, a Sherman Act problem, and a CFO with a face. The Q4 2025 earnings cycle is the closing chapter of their story: the old tool is gone. Not stacked. Not temporarily idled. Gone. HAL pulled the last of the conventional excess capacity off the market and is holding it in reserve to be reactivated at a price of their choosing, which is a different thing than capacity that is available at any price. When the seller controls the release valve, the buyer does not control the pressure.
The cascade from here is straightforward if you follow it in sequence. Conventional diesel is off the table as a competitive tier. Tier 4 DGB is now what diesel used to be — the commodity floor, the equipment receiving maintenance-only capital, the fleet that every service company still runs but none of them are growing. Next-generation electric and mechanical drive is where newbuild capital is going, and most of that capital is chasing power infrastructure and international markets, not more frac fleets. The service companies have spent four years methodically eliminating their own worst alternative — cheap conventional supply they could not profitably stack — while simultaneously building yours. That is the complete picture.
Here is what it means in practice.
If you are running DGB equipment in 2026, stop optimizing for rate and start optimizing for reliability. The capital that used to maintain your vendor’s fleet is leaving. Simul-frac customers get the maintenance CAPEX that remains, because simul-frac is where the margin is. A further concession on stage rate from a vendor whose fleet is being systematically underfunded does not reduce your completion cost. It increases it — it just moves the cost from the invoice to the NPT report. Build performance standards and equipment quality provisions into the contract before you negotiate price. The vendor running a properly funded maintenance program signs those terms without objection.
Start with a should-cost model. You do not need Kalibr Pulse to build one. Public financial disclosures give you fuel consumption benchmarks, maintenance cost ranges, crew cost data, and the margin math at current activity levels. What you are looking for is whether the bid in front of you is fundable at the performance standard your program requires, or whether the vendor is borrowing from future reliability to win today’s award. The gap between a sustainable margin and the clearing price in your RFP is the leading indicator of future downtime. Build the model. Read the gap.
Long-term, the question is optionality. The technology choices you are making today in development planning have a longer shadow than they appear to. A Zeus-optimized program is a program designed around pad configurations, water logistics, and well sequencing that is incompatible with conventional fleet economics. That is a feature when Zeus is available and performing. It is a constraint when it is not. Before you build pad architecture around any single provider’s fleet specifications, understand what you are giving up and for how long.
If you have a consistent completion program outside the Permian and you are not currently in conversations with ProPetro, have the conversation. The Permian service market is facing structural headwinds — too many fleets concentrated in one basin with anchor customer commitments unwinding. ProPetro has genuine operational density in the basin that does not travel easily, but the financial math of their current situation creates negotiating conditions that will not persist indefinitely. A non-Permian E&P with a reliable program is exactly the customer they need right now, which means you have leverage you will not have in eighteen months.
Finally: if this situation looks familiar, it should. What happened in the frac market over 2023 to 2025 — systematic retirement of commodity capacity, capital concentration in premium equipment, service company leverage rebuilding as the commodity alternative disappeared — is structurally identical to what happened in compression in the early 2020s. The compression playbook that worked then works here. Think about what you did differently when you understood that the old commodity compressor fleet was not coming back, and apply the same logic to what you are signing in frac today.
The tool manufacturer built three new tools, retired the old one, and handed you a market where the commodity option no longer exists. The question they are waiting to see answered is whether you noticed before you signed the renewal.