

Kalibr Sweep | October 2025
The Masters, the Molecule, and the Economics of Leverage

I am going to connect Taylor Swift’s recording economics with methanol production prices. Come on the wild ride.
As the father of a fifth-grade girl, most of my weekend was spent as an unpaid Uber driver whose Aux chord was hijacked with Swift’s new album on repeat. I tried to explain the brilliance of her business model. My daughter asked me to turn up the volume.
Since you are a better audience, let me explain what Swift’s catalog can teach us about operating expenses in oil and gas.
Re-recording as Market Power
In music, the masters are the original recordings that generate all downstream royalties. Swift owned the songwriting rights but not the recordings. When her label sold those masters to private equity, she lost control of monetization.
She re-recorded the albums, creating competing assets that she controlled. Her fan base shifted consumption to the new versions, turning the old ones into stranded assets. In economic terms she created redeployment optionality, the ability to take an existing asset and move it into a new profit stream.
The result was a reversal of leverage. The label’s best alternative was to sell an unwanted catalog. Swift’s was to monetize identical songs under her own ownership. It was a hostile takeover of an intangible asset class executed without litigation.
The Same Game, Different Molecule
Operating expenses in oil and gas follow the same logic. Let me explain.
Most concern sits in three categories: compression, water, and chemicals.
Production chemicals are where the analogy becomes practical. They are essential, expensive, and structurally opaque. Methanol is a useful case study because its market is well-defined and its economics are transparent enough to model. But methanol is only one molecule in a broader chemical ecosystem that includes scale inhibitors, corrosion inhibitors, surfactants, and H₂S scavengers. Each of those categories carries the same game-theory structure and deserves the same level of analytical care.
Methanol: Market Intelligence as a Game of Margins
Methanol is central to flow assurance in Appalachian gas operations and chronically mispriced. Understanding it requires analysis of market structure and cost floors rather than contract management.
Market Structure
Global capacity is about 95–100 million tons, controlled by roughly 25 producers including Methanex, OCI, Proman, SABIC, and Celanese. The industry behaves like an oligopoly.
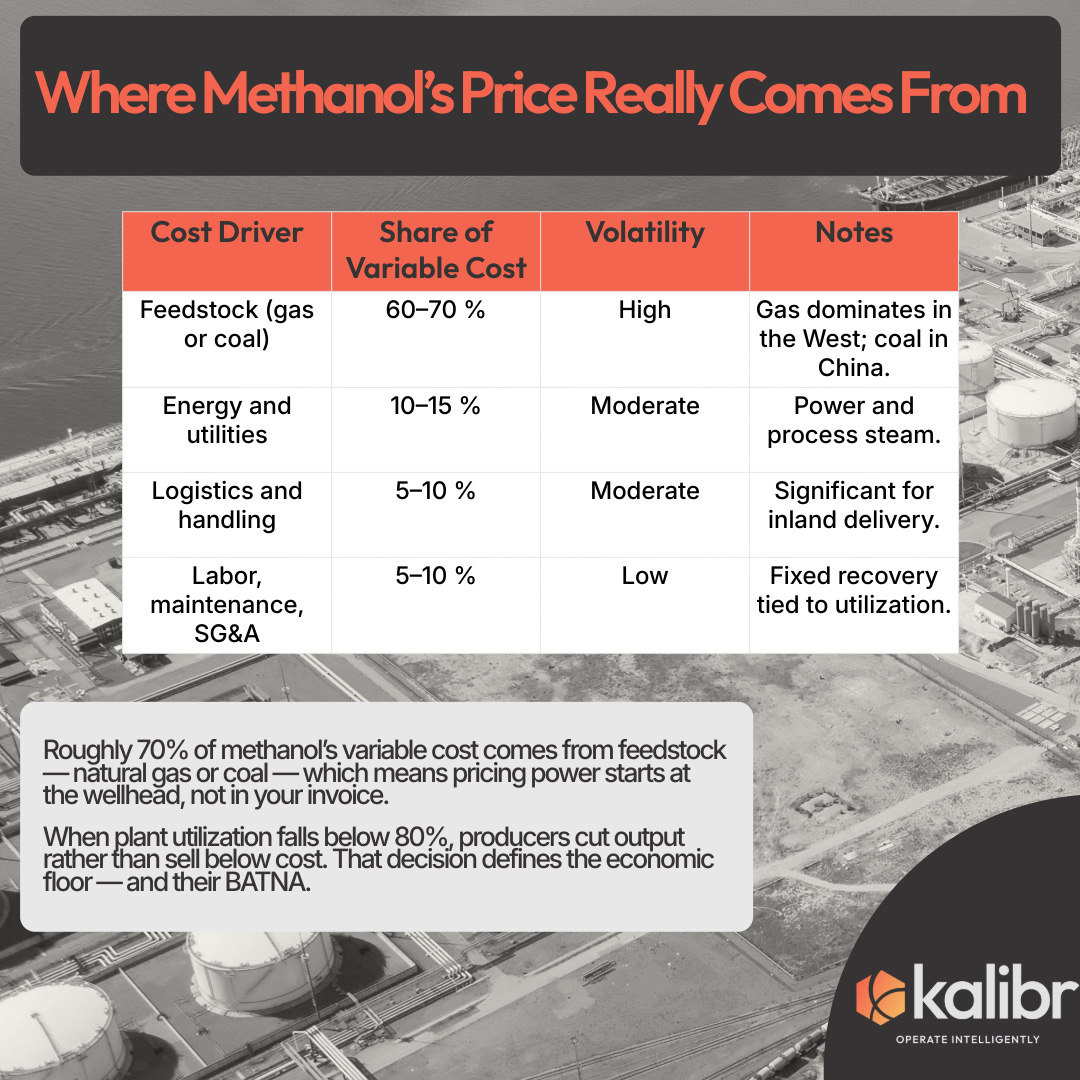
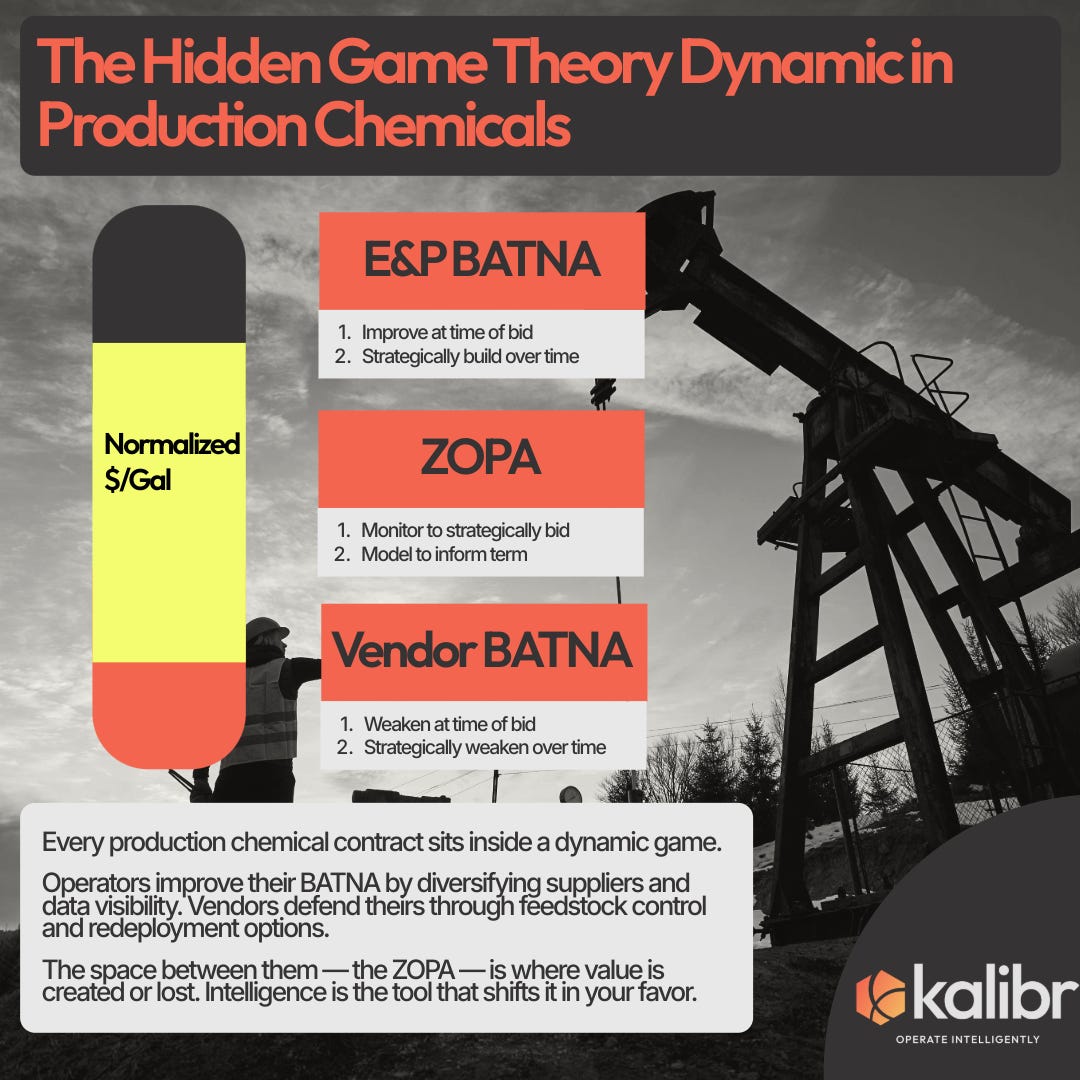
When utilization falls below 80 %, marginal producers curtail output rather than sell below cost. That cost floor defines the producer’s BATNA.
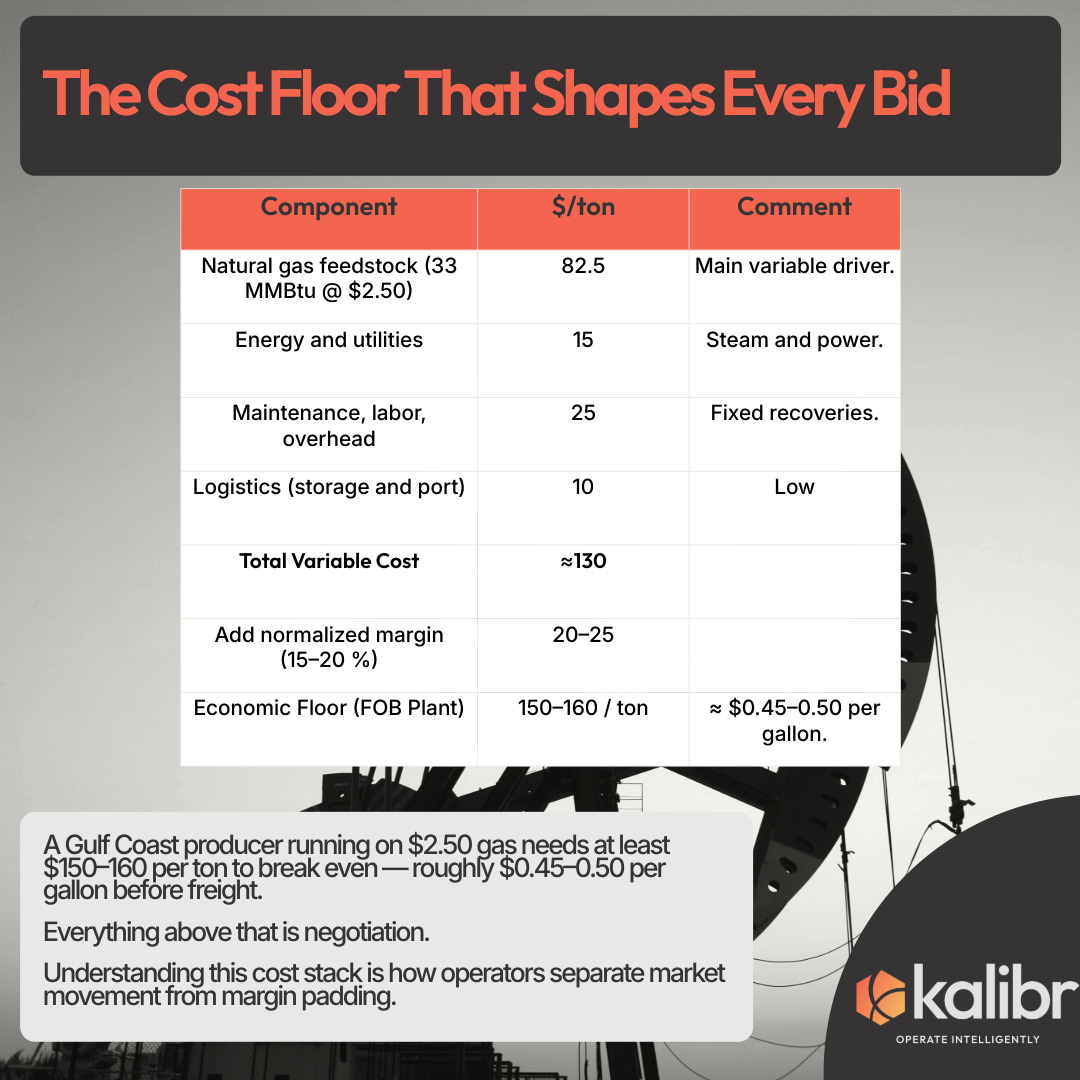
Let’s say we are operating in my home state of Pennsylvania. Delivered into Appalachia, trucking, handling, and hazmat premiums lift that floor to about $0.75–0.90 per gallon.
When Methanex’s North American posting fell from $891 per ton in Q1 2025 to $778 in Q3, any invoice still indexed to January pricing transferred roughly $0.40–0.60 per gallon of margin to the supplier. On a $17 million chemical program, that equals $1–1.5 million in silent cost.
Counterparty Map
Only about 5 % of global methanol demand comes from oil and gas. The rest comes from industries that set the real price signal.
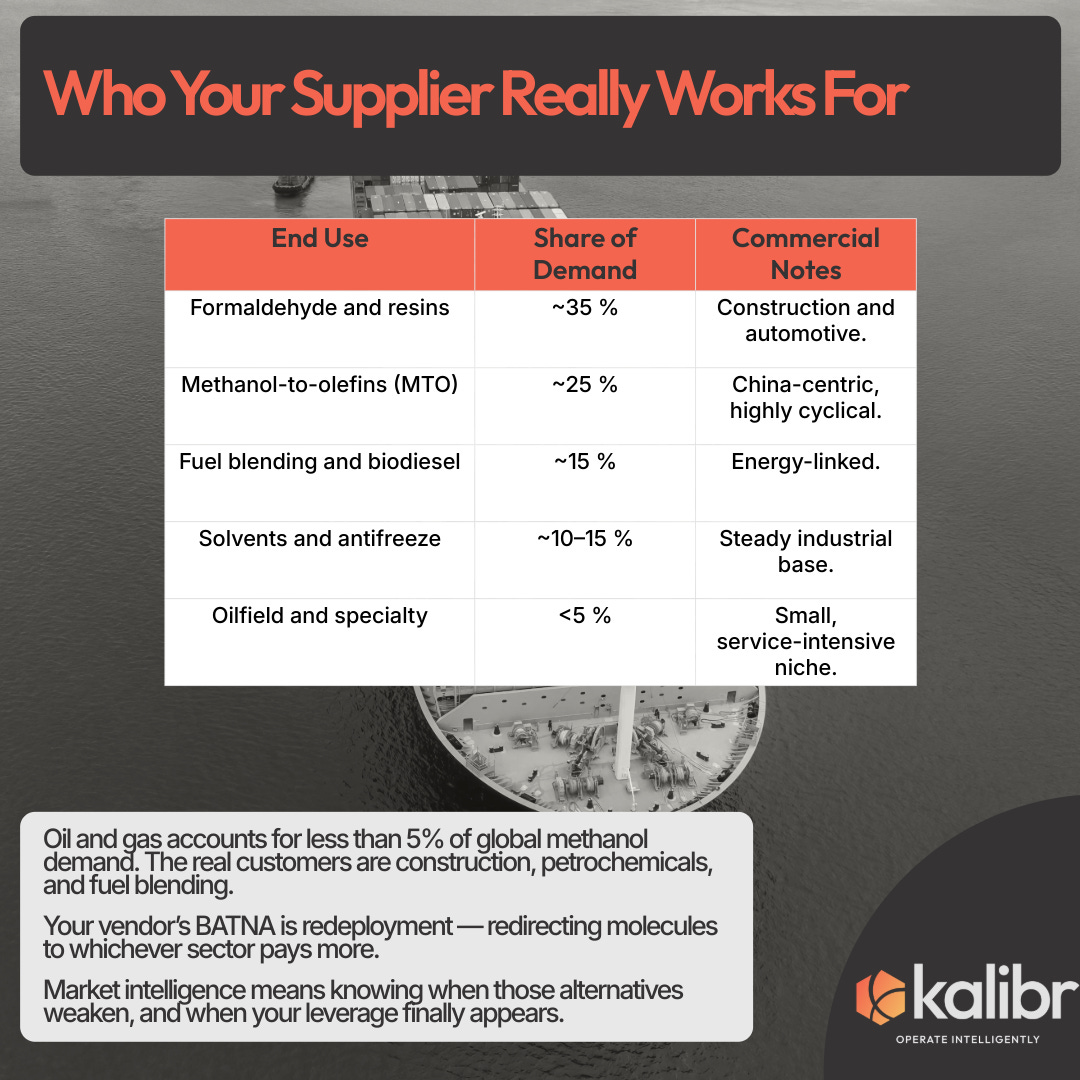
When Chinese MTO margins weaken, producers redirect tonnage west and pricing eases. When MTO margins strengthen, oilfield demand becomes secondary. The supplier’s BATNA is the next-best buyer in another industry. The operator’s BATNA is keeping production online.
Intelligence Inputs That Shift Power
Procurement leverage depends on information symmetry.
Feedstock Margins – Track the natural-gas and methanol spread. Narrowing margins weaken the producer’s position.
Utilization and Trade Flows – Monitor outages, MTO run rates, and export volumes. Utilization below 85 % signals excess capacity.
Freight Differentials – Hazmat linehaul into Appalachia averages 9 % above dry-van. When that spread contracts, capture it.
Strategic Interpretation
Market intelligence is not forecasting; it is mapping incentives.
Know what it costs the producer to make the molecule, what it costs you not to buy it, and how both numbers move with feedstock, utilization, and freight.
Methanol’s behavior reflects redeployment optionality. Producers defend a cost floor and multiple revenue channels. Operators defend uptime and continuity. The side with better information about the other’s constraint captures the margin.
And while methanol is the cleanest case study, it is only one molecule in a much larger OPEX puzzle. Scale inhibitors, corrosion inhibitors, defoamers, and every frac additive in between follow the same economic script. Each should be analyzed with the same discipline.
That is the economics of methanol. It is also the playbook for everything else in the barrel.